Hydraulic Fracturing Technology
Variable-Rate Frac Boosts Production
By Jordan Ciezobka, Debotyam Maity and Iraj Salehi
DES PLAINES, IL.–Hydraulic fracturing designs in shale plays typically utilize a predetermined fluid pump rate, which once achieved, is held constant throughout the treatment except for situations where surface pressure limitations or other conditions prevent it.
But what happens when pump rates are intentionally varied during treatment instead of kept constant? Could implementing variable rate hydraulic fracturing increase stimulation efficiency without adding additional cost?
Previous hydraulic fracturing and microseismic data collected in the Marcellus Shale indicated that substantial rapid changes in fluid pump rates during hydraulic fracturing can in fact result in increased levels of microseismic activity emanating from the stimulated reservoir, which might be interpreted as creating more fractures, leading to additional fracture complexity.
To investigate these observations, a study was conducted in a Marcellus horizontal well. During frac treatment, variable pump rates were implemented in all the odd stages while rates were kept constant in all the even stages to account for changes in the reservoir along the lateral. The variable-rate design rapidly changed the fluid pump rate from a predetermined maximum to a significantly lower rate, and then rapidly increased back to the original maximum rate, while pumping each stage.
Surface fracturing pressure data show that rapid pump rate changes open additional perforations without physical flow diverters such as ball sealers or frac balls, while production log data indicate higher production from stages with variable rates. Specifically, the rapid rate changes produce a “pressure pulse” that travels up and down the wellbore to open previously unopened perforations and increase fracture complexity through fluid diversion.
Increased microseismicity was observed while fracturing the stages with frequent pump rate changes. Regardless of their type and nature, seismic signals indicate fragmentation of the stimulated rock. This could be from shear slipping or dilatational opening. One also can assume that high signal density is a good measure of fracturing efficiency.
Production log results showed an average 18 percent increase in production for the stages pumped with variable rates versus the stages pumped at a constant rate. A lower treating pressure was often encountered after the rapid rate changes, leading to the conclusion that unopened perforations were opened with the induced rate changes, and resulting pressure pulses. Moreover, the total production decline was much slower for the test well treated with variable pump rates than an offset horizontal well that did not include the variable pump rate frac design.
In addition, water hammer frequency decay analysis shows a predictable trend in the well with variable pump rate stages. Throughout the variable pump rate stages, no proppant transport issues were encountered and the frac stages were completed without any major problems.
Project Motivation
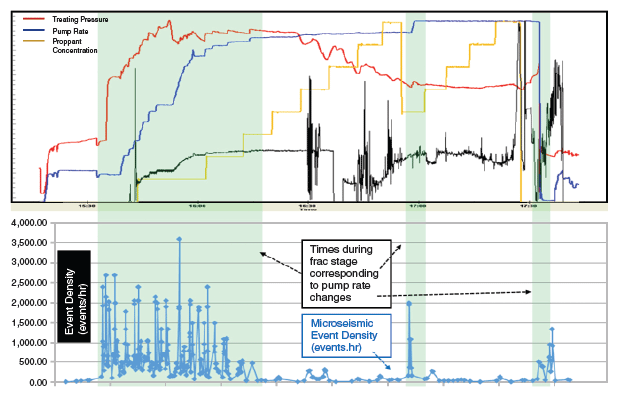
FIGURE 1
Typical Marcellus Frac Stage (Top) and Microseismic Event Density During Treatment (Bottom)
The top of Figure 1 shows a typical hydraulic fracturing treatment in the Marcellus with treating pressures (red) and pump rates (blue). The bottom of the figure shows bore hole microseismic event density aligned to the treatment plot, with the shaded columns corresponding to rapid fluid pump rate fluctuations. In this case, however, the exact sequence of rate changes was not planned. The changes were related to pumping equipment or wellbore conditions.
Microseismic event density clearly significantly increases during rapid pump fluctuations, both positive and negative. Similar pump rate fluctuations and microseismic event density correlations have been attained with a dataset consisting of almost 100 fracture stages in the Marcellus.
Furthermore, production log data collected in the horizontal lateral and compared with the microseismic survey results show the microseismic event count and event proximity (proximity of each microseismic event to the next closest recorded event) for each fracture stage correlate with production from each fracture stage. The log data indicate increased production coming from fracture stages where the microseismic event count is high, while the production contribution also is reduced in stages where the event count is low.
These findings were the motivation for the Marcellus field study of the variable-rate frac method. The project sought to test a hydraulic fracture treatment designed to rapidly fluctuate the pump rate in a controlled and systematic sequence, so that rate fluctuations were intended, rather than a result of unanticipated equipment or wellbore conditions.
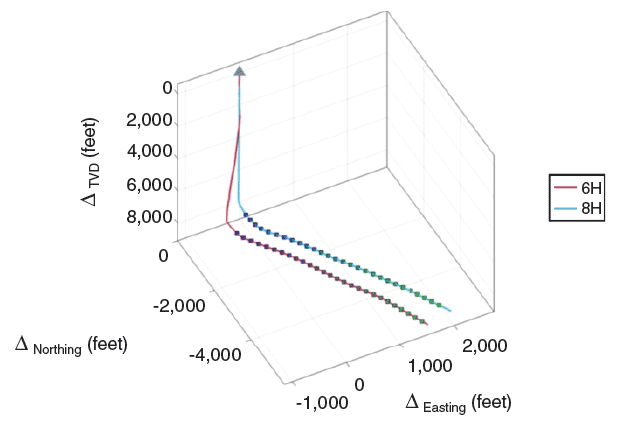
Figure 2 shows the well pad diagram highlighting the two laterals (Wells 6H and 8H) that were studied. Another lateral (4H) extends on the other side of the 8H well, but is not shown in the diagram. Interwell separation varies between ~700 and 1,000 feet laterally for wells 6H and 8H. Both wells were designed to land in the lower Marcellus Shale. As observed from the figure, Well 6H had a total of 27 completed stages and 8H had 28 completed stages.
The frac design involved ~200,000 pounds of proppant (100- and 40/70-mesh white sand) pumped with ~200,000 gallons of water for Well 6H. The stages pumped in Well 8H had about 50 percent more proppant (~300,000 pounds) and higher frac fluid volumes. With larger proppant and fluid pumped in the 8H well, initial productivity in terms of gas flow rates from the well were expected to be higher than the 6H well.
Validating The Results
Four methods involving both direct and indirect diagnostic techniques were deployed to validate the efficacy of the variable-rate fracturing technique: production logging, pressure responses to rate fluctuations, post-completion well production performance, and post-pumping shutdown water hammer diagnostics.
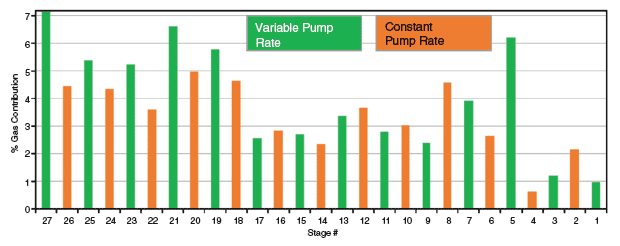
Production log results were observed immediately post-completion for Well 6H where rate fluctuations were introduced (Figure 3). While there was significant variability in production behavior over the entire lateral because of completion quality as well as exact location of the lateral compared with reservoir stratigraphy, more often than not, variable-rate (odd) stages showed higher productivity than nearby even stages.
Another inherent assumption with using variable-rate fracturing is that it should ideally open additional perforations that may not have been opened fully during the initial breakdown. This should allow for a more uniform distribution of fluid flow into the formation across available perforation clusters. Summing the skewness measure for flow distribution across clusters for each of Well 6H’s 27 stages shows a very low summed measure for odd stages (0.5394) compared with the even stages (4.8528).
Looking at overall productivity from odd and even stages separately, cumulative productivity from odd stages is 915.3 Mcf a day compared to 721.1 Mcf/d for the even stages. There is one additional odd stage for this well, but the same trend is evident when evaluating average productivity per stage (65.38 Mcf/d for odd stages versus 55.47 Mcf/d for even stages). This represents 17.87 percent higher productivity with variable-rate fracturing.
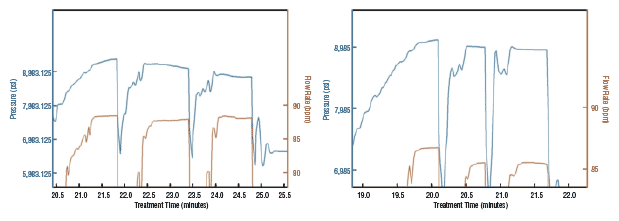
Since a lower skewness measure was evident for the variable-rate frac stages, the study then looked at the behavior of treatment pressure after introducing pump rate fluctuations. Figure 4 shows examples of two odd stages completed in Well 6H, with drops in treatment pressure ranging from tens to hundreds of psi, which is indicative of lower entry friction within the system. This could either mean additional opening of perforations related to the pressure transient pulse generated by fluctuating pump rates (i.e., reduced perforation friction), or a consolidation of nondominant fractures emanating from the wellbore (reduced tortuosity).
Water Hammer Diagnostics
The wellbore and associated hydraulically created fractures during the treatment phase of a fracture stage create a complex hydraulically connected conduit where unsteady-state transients are common. As the pumping of proppant and slurry ends and the pumps shut down, and depending on the shutdown procedure, the transition from steady-state constant flow to low or no flow conditions creates single or multiple water hammers within the wellbore.
FIGURE 4
Sample Treatment Pressure/Flow Profiles after Introducing Rate Fluctuations for Well 6H Stages 9 (Left) and 17 (Right)
Since the decay in energy over the water hammer cycle is a function of the total frictional head loss as the pressure pulse travels up and down the conduit, it is intuitive to expect the decay in energy to be higher for a longer conduit.
In the same vein, the decay also should be higher if an extensive large-aperture fracture network is associated with the stage, which will consequently absorb more energy as the pressure pulse moves through the network. Moreover, complex natural fracture network swarms, coupled with hydraulic fractures, should lead to a shorter oscillating pressure response with a higher decay rate as a result of higher frictional losses compared with long planar fracture wings.
Unlike Well 6H, all of the stages in Well 8H were completed using the traditional design with no rate fluctuations. If variable-rate pumping opens additional perforations and creates greater fracture propagation/growth, one would expect stages completed with variable-rate pumping to exhibit stronger decay in signal strength with time than stages completed at constant pump rates.
The study used a simple decay rate modeling approach with an exponential decline model to compute the decay rates in energy observed at pump shutdown for each of the completed stages for the two wells. Pump shutdown procedures for long-lateral multistage completions can be quite random and result in highly skewed pressure transients, which do not allow for easy decay rate computations. In order to resolve this issue in the study, a simple detrending operation was carried out using a polynomial fitting approach.
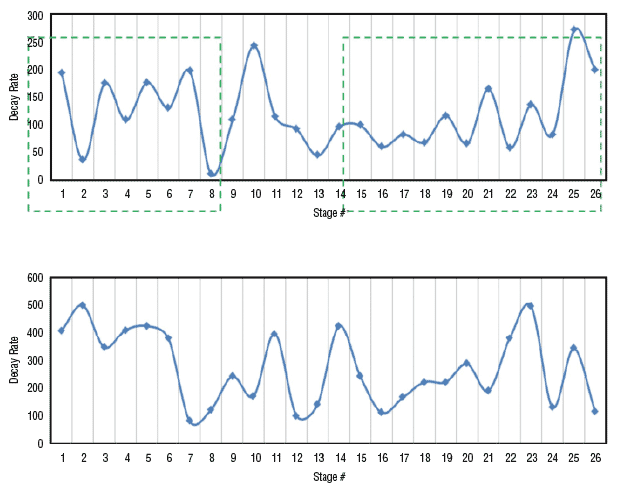
The analysis was conducted for the first 26 of the 27 stages in Well 6H and for the first 26 of the 28 stages in 8H. Figure 5 highlights the modeled decay rate for all stages analyzed. There is a clear and discernable trend of higher decay rates for the odd stages compared with corresponding even stages, except for stages 10-14 in Well 6H. The pressure response observed for stages 10-13 follows the skewed behavior observed in stage 9 in Figure 4. This indicates that the observed discrepancy could be a result of a modeling failure and not an actual indicator of decay in pressure response (stage 26 was the only other stage where this behavior was observed).
The average decay rates for Well 6H were 143 for odd stages and 95 for even stages, while Well 8H’s decay rates averaged 307 and 334, respectively. On a percentage basis, the odd stages for Well 6H had a 33 percent higher decay rate than the even stages (the odd stages in the 8H had an 8 percent lower decay rate than the even stages).
Production Performance
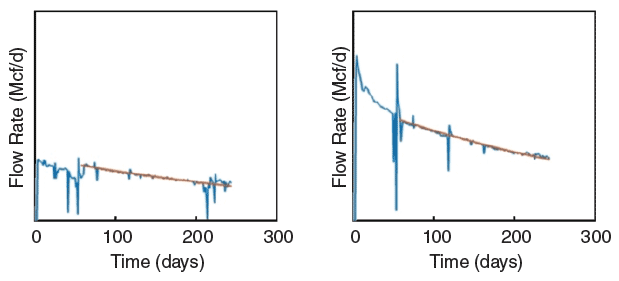
Figure 6 shows the production profiles observed in the first eight months of operation for wells 6H and 8H. The charts highlight exponential decline functions fitted to relatively clean portions of the profiles (three months onward) to understand the decline behavior in the two wells. Reasonably good fits were observed for both wells.
The analysis found a lower exponential decline rate for Well 6H (-0.0022) compared with 8H (-0.0028). This is despite the fact that 8H had more proppant pumped per foot of lateral and had access to a larger reservoir drainage volume because of the presence of a single well on its left flank (6H has wells 8H and 4H flanking it on either side). This indicates better long-term productivity and a lower decline rate for Well 6H thanks to a potentially larger stimulated reservoir volume per foot of lateral available.
By inducing a rapid rate change that could lead to significant pressure pulses capable of opening perforations and increasing the complexity of the induced fracture network, the variable-rate design increased production from odd stages by double digits on a percentage basis in the Marcellus study well. Based on these encouraging results, additional experiments are planned, including fracturing an entire Permian Basin horizontal well from toe to heel with a variable-rate treatment.
This next step in developing and testing the method will incorporate more aggressive rate changes engineered specifically to accommodate Permian completion designs, and implement the variable-rate design in all frac stages in a horizontal well. In addition, the completion will add diagnostic instrumentation to determine fracture geometry and individual stage production with microseismic monitoring, production logging, and fluid and radioactive tracer data.
Editor’s Note: The co-authors acknowledge the Research Partnership to Secure Energy for America for providing funding for the project, and WPX Energy Inc. for providing substantial cost-sharing data and wells of opportunity.
JORDAN CIEZOBKA is a senior engineer at the Gas Technology Institute, focused on hydraulic fracturing research and other stimulation techniques. He started his career as a field engineer with a major oil field service company, and has experience in designing and executing hydraulic fractures in many unconventional formations, including tight sands and shales. Ciezobka holds a B.S. in mechanical engineering and a minor in electrical engineering from Purdue University.
DEBOTYAM MAITY is a principal engineer, exploration and production, at the Gas Technology Institute. His work focuses on research related to geophysics and production engineering in shale gas plays, including analyzing and optimizing hydraulic fracturing programs. He began his career as a field operations and panel engineer at Reliance Industries in India. Maity holds a bachelor’s in chemical engineering from R.V. College of Engineering, and an M.S. and a Ph.D. in petroleum engineering from the University of Southern California.
IRAJ SALEHI is a senior institute scientist at the Gas Technology Institute. An experienced geoscientist who has served at GTI since 1985, he is well versed in all aspects of upstream oil and gas operations. His experience in designing, constructing and operating advanced laboratories led to the development of GTI’s hydrates laboratory. Salehi holds an M.S. in geophysics from Stanford University.
For other great articles about exploration, drilling, completions and production, subscribe to The American Oil & Gas Reporter and bookmark www.aogr.com.


