Natural Gas Price Forecast
Bold Action Required To Restore Financial Health Of U.S. Oil And Gas Industry
By Andrew D. Weissman
WASHINGTON–The shale gas and tight oil revolution has sparked phenomenal growth in U.S. production. At the same time, technological innovations have enabled giant strides in drilling, completion and production efficiencies.
These breakthroughs continue to transform both U.S. and global energy markets. On the oil side, America’s independent producers have proved up vast tight oil reserves. In so doing, they have brought an end to an energy supply crisis that has defined oil markets for decades, shattering the OPEC cartel and any notion of unity in its ranks.
The impact of shale gas has been equally dramatic, reducing natural gas and electricity costs in the United States, Canada and Mexico by nearly $400 billion annually, while providing the impetus for a renaissance in American petrochemical and manufacturing industries. Over the next few years, as U.S. liquefied natural gas projects come on line, the global natural gas market is also likely to be transformed–reducing electricity and natural gas costs around the globe and diminishing Russia’s ability to intimidate European consuming markets.
These are stunning accomplishments, and the inevitable result will be more secure and affordable energy supplies at home and abroad. However, this brighter energy future unfortunately comes with a steep near-term price tag for U.S. oil and gas producers. Consequently, after a decade of leading the world into a new era of unconventional oil and gas resources, the domestic industry finds itself in urgent need of strong and focused leadership.
The pace at which domestic operators increased oil output astounded many market observers. As recently as two years ago, for example, analysts were predicting that U.S. oil production would peak at 8.2 million barrels a day in 2020–a prediction that soon was left in the dust as oil production climbed to a peak 9.6 MMbbl/d in April 2015.
U.S. natural gas production from shale reservoirs has surged also. In 2014, annual shale production jumped by 2 trillion cubic feet, or enough to satisfy total domestic demand growth over the past decade.
Dry gas production from shale now totals 41 billion cubic feet a day. If demand was strong enough to justify completing the huge backlog of drilled but uncompleted (DUC) wells, total production might be closer to 50 Bcf/d, which would represent a 10-fold increase over shale production 10 years ago.
Unfortunately, the impact of the shale revolution on the upstream sector’s financial health has turned brutal. Over the past 12 months, at least 37 oil and gas companies have filed for bankruptcy, and large independent producers have lost billions in market capitalization.
The pain certainly will not last forever. The price declines of the past 12 months have triggered steep cutbacks in capital expenditures. While these cuts have been largely offset by continued improvements in drilling productivity, additional 2016 budget reductions are likely. More than $200 billion worth of oil and gas projects were deferred or canceled around the world in the first six months of 2015, ironically matching industry estimates of the revenue costs to OPEC members since Saudi Arabia began to boost its production to recapture lost market share.
The ongoing curtailing of capital investment in supply-side projects, including those with long lead times, will have a significant impact on prices at some point. The question is when.
‘Significant Uncertainties’
The U.S. Energy Information Administration projects that West Texas Intermediate crude oil prices will average $51/bbl in 2016. It is important to recognize, however, that published price forecasts often are misleading. In fact, EIA itself acknowledges that its outlook is “subject to significant uncertainties,” and concedes that oil prices could experience “periods of heightened volatility.”
EIA’s projection assumes the Organization of Petroleum Exporting Countries will cut production by nearly 1.0 MMbbl/d, reducing total production to 30.75 MMbbl/d in the first quarter. EIA also assumes Iran will not increase production significantly until late 2016, and that even when it does, total OPEC production will remain below current levels. EIA further assumes that U.S. production is on track to decline to 8.6 MMbbl/d by next June (1.0 MMbbl/d below the April 2015 peak).
Notably, however, even using these aggressive assumptions, EIA concludes that global supply will exceed demand throughout 2016, with global inventories rising for four straight quarters, albeit at a much slower pace. The assumptions used in EIA’s analysis are questionable, at best.
Despite occasional conciliatory statements by Saudi Arabia, for example, there has been no evidence that OPEC members are prepared to cut production. Instead, even before taking into account possible increases in OPEC production, it is more likely that OPEC crude output will remain at 31.50 MMbbl/d-31.75 MMbbl/d.
Furthermore, Iran is one of the most experienced oil producers in the world, and has had more than a year to prepare for the end of sanctions. The likelihood that it will achieve its goal of increasing 500,000 bbl/d soon after sanctions are lifted should not be dismissed lightly. Additional increases also are likely in late 2016.
Global oil inventories rose an estimated 1.8 MMbbl/d through the first three quarters of 2015, and EIA projects that an average of 400,000 bbl/d will be added to stockpiles in 2016. Using more realistic assumptions, however, unless OPEC abruptly changes its policy or energy infrastructure in the Middle East or West Africa is attacked by terrorists, the global surplus easily could be 1.0 MMbbl/d-1.5 MMbbl/d, potentially adding another 350 million-500 million barrels of excess global supply.
It is obviously not all about production. Demand growth also is paramount. The International Energy Agency reports global oil consumption grew at the rate of 1.8 MMbbl/d in 2015–the strongest increase in five years. IEA projects an additional 1.2 MMbbl/d in demand growth for 2016, but it will take time to work off the surplus of crude oil and finished products in storage to allow global supply/demand to reach equilibrium and provide the impetus for a significant price rebound.
Natural Gas Outlook
Near term, in the wake of steep price declines in November, the prospects for rebounding U.S. natural gas prices are better, but not dramatically so. As is always the case for the gas market, weather plays an important role.
EIA estimates Henry Hub prices will average $3.00 an MMBtu in 2016. However, that outlook generally is premised on normal weather, and temperatures in the first month of the winter heating season were far from normal. November’s warm weather pushed the amount of gas in U.S. storage facilities to above 4.0 trillion cubic feet for the first time, with the U.S. supply surplus exacerbated by near-record Canadian storage levels.
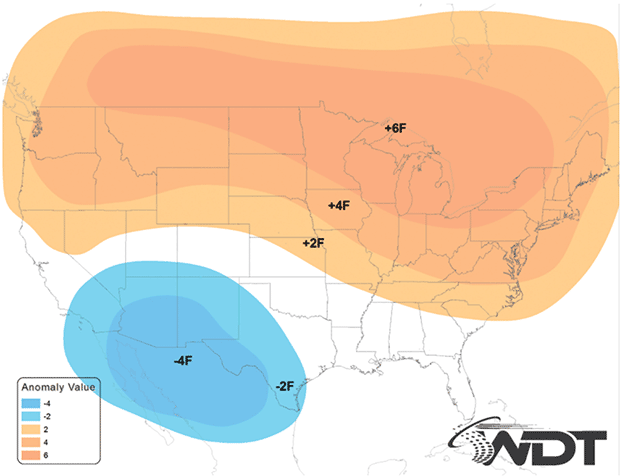
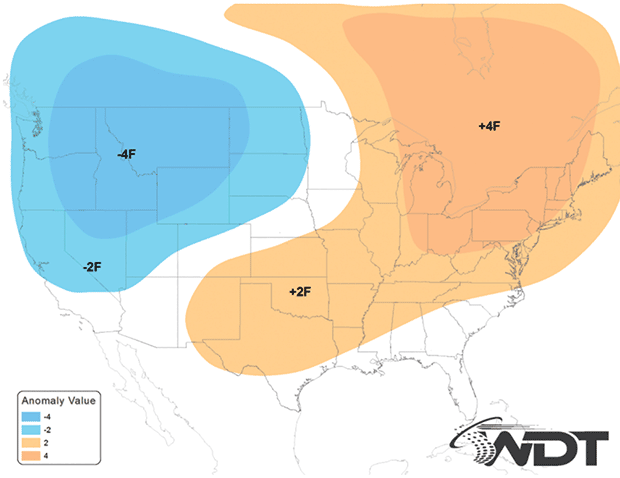
Furthermore, nearly every weather service provider is predicting very mild weather during the heart of the heating season. For example, Weather Decision Technologies Inc. forecasts a 70 percent likelihood of warmer-than-normal weather in January in areas that ordinarily account for the most space heating demand, followed by a 60 percent chance in February (Figure1).
The potential for an unusually warm winter, coupled with increased U.S. production in the final two months of 2015, were the primary factors triggering the November price nose dive, which in turn, knocked January and February futures contracts into the $2.30/MMBtu range prior to Thanksgiving.
Winter space heating demand is the most important gas price factor during each storage cycle, with potential consumption swings of 1.0 trillion cubic feet or more, depending on winter weather. If forecasts prove accurate, there is little chance of a return to EIA’s predicted $3.00/MMBtu price in 2016.
However, the November sell-off, which drove December 2015-October 2016 NYMEX futures contracts to about $2.40/MMBtu, most likely went too far. Deeply depressed cash market prices prompted high levels of coal displacement, pushing natural gas consumption in the electric generation sector to record levels this fall. Continued low prices could boost power sector gas demand by more than 600 Bcf compared with last winter, offsetting much of the impact of warm temperatures.
Therefore, despite record storage and increasing end-of-year U.S. production, storage withdrawals likely will be stronger than many market analysts predict at current cash market prices, helping reduce the storage overhang by winter’s end.
Moreover, core (not weather-related) demand is expected to expand as a result of increasing Mexican exports, additional coal and nuclear plant retirements, major Gulf Coast industrial projects starting, and U.S. LNG exports commencing with the first two trains at the Sabine Pass terminal. If low oil prices persist, production of associated gas also could start to decline.
Consequently, the U.S. gas market should begin to gradually tighten during the 2016 injection season. Even with very mild weather this winter, natural gas prices are likely to rebound by 5-10 percent by late winter/early spring.
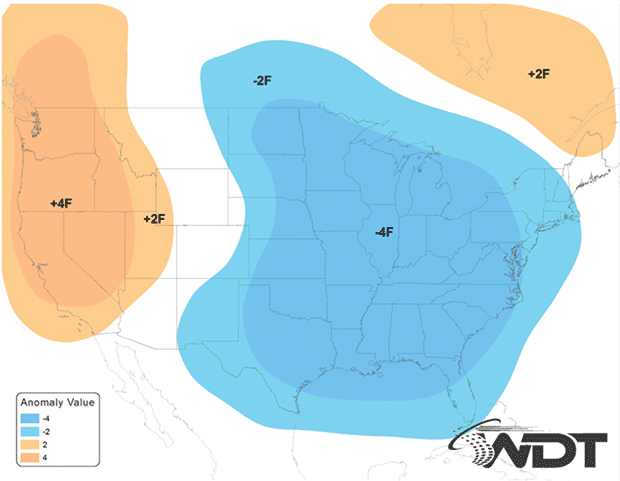
FIGURE 2B
February 2016 Alternate Forecast (40% Odds)
Sources: Weather Decision Technologies, EBW Analytics
It should be noted that contrary to market expectations, mild winter weather is not a lock. Instead, depending on developments in the Pacific Ocean, there is still a substantial possibility of much colder-than-normal weather by February (Figures 2A & 2B).
If this occurs, it could add as much as 125 Bcf of demand, mitigating the impact of mild early winter temperatures. End-of-winter storage could fall below 1.800 Tcf. At least for a few weeks, cash market prices might climb above $2.50, temporarily pushing March-October 2016 contracts to an average of $2.65-$2.85/MMBtu.
Increasing Core Demand
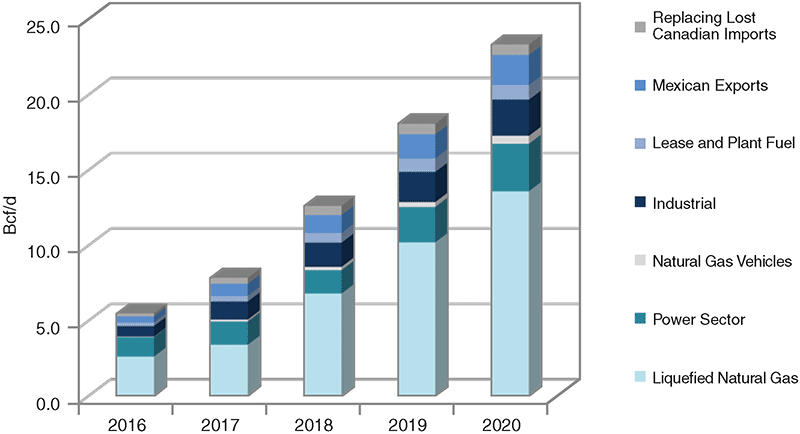
The bigger and better news is that beginning in 2017, core U.S. demand for natural gas is likely to increase. The extent of this growth will depend heavily on the completion of six LNG export projects–Sabine Pass trains 1-4, Freeport trains 1-3, Cove Point, Cameron trains 1-2, Sabine Pass trains 5-6, and Corpus Christi trains 1-3–and these terminals’ ability to compete in a global LNG market that is expected to be significantly oversupplied for several years.
With exports to Mexico and industrial demand continuing to rise, the success of U.S. LNG export projects would increase core daily U.S. gas demand significantly over the next four or five years (Figure 3).
If U.S. producers show restraint in increasing production, the excess supply that has plagued the U.S. market since 2012 could finally begin to be sopped up. That said, it is critical for producers to be realistic regarding how strongly natural gas prices may rebound in 2016 or subsequent years.
Unless producers immediately institute steep drilling cuts, Henry Hub prices are likely to average less than $2.50 between January and October, even if cold weather arrives in February. This is partly because of the huge backlog of DUC wells in the Marcellus Shale.
Near term, some experts believe that if prices in the Marcellus were to increase to even $2.25/MMBtu (versus a 2015 Dominion North average of less than $1.40/MMBtu), the expanding take-away capacity in the Northeast would fill quickly, potentially increasing production by 8 Bcf/d.
At $2.50/MMBtu, production in the Haynesville and Fayetteville also would likely respond in short order, preventing NYMEX futures prices from rising above $2.50/MMBtu for an extended period. If mild weather continues through spring, prices could be much weaker.
Just as importantly, however, absent taking specific steps to strengthen the industry’s position, prices at most major trading hubs could remain in the $2.50/MMBtu range for much of the rest of the decade, even in years in which winter weather is close to normal. Prices could be much lower in years with mild winters.
A consistent $2.50/MMBtu price may be acceptable to some producers. The industry’s success in lowering development costs and finding attractive reserves continues to dazzle. A number of producers with reserves in shale play core areas are able already to earn attractive margins at Henry Hub-equivalent prices of $2.50/MMBtu–and not only in the Marcellus Shale, but also in the Utica, Haynesville, Fayetteville, and Eagle Ford gas window. Furthermore, if oil prices firm, production of associated gas (which is relatively insensitive to natural gas prices) could become an increasingly important supply source.
In two-three years’ time, as productivity continues to improve and additional low-cost targets are identified, the number of opportunities to earn attractive margins at these price levels is likely to increase. This is critical, because in the end, margins determine profitability. While prices in the $3.00-$3.50/MMBtu range would be welcome, they are not necessarily essential for the industry’s longer-term prosperity.
Adjusting To Future Demand
However, there is a risk that a “worst of both” scenario could develop. Given the industry’s demonstrated ability to raise production quickly, prices may seldom rise above $2.50/MMBtu, except for brief periods.
Unless the industry reigns in its tendency to ramp production too quickly, the market may frequently be oversupplied during most months of the year, pushing prices significantly lower and shrinking or altogether eliminating margins. Moreover, when weather conditions are milder than normal, prices could crater, putting intense downward pressure on many producers’ balance sheets.
This obviously would be a serious blow for natural gas-heavy producers, but it could negatively impact oil producers also, since it would sharply reduce the value of associated gas in a world with limited upside potential for oil prices. Producing companies could struggle frequently. Like other capital-intensive industries, profit margins could be modest even in years in which demand was reasonably strong. In years in which demand falters, cash flows could dip perilously low.
The potential for this scenario should not be dismissed lightly. Instead, several factors suggest it is actually the most likely one, absent forceful action by the industry to increase production cautiously in step with demand growth.
First, the strongest demand increases will not occur until 2019-20. In the interim, given the huge backlog of DUC wells, the industry likely will be able to easily adjust to expected increases in demand by quickly boosting production in the Marcellus and a number of other plays without appreciable upward price pressure.
Unfortunately, any price increase would reduce coal displacement almost instantly, offsetting increases in core demand. In fact, EIA predicts that as renewable energy continues to be deployed, power sector consumption of natural gas could decline sharply from 2015 levels.
Second, there is substantial reason to expect further breakthroughs over the next few years, with new low-cost supplies added and productivity continuing to improve. In this regard, Deep Utica gas could prove to be particularly significant. Some already contend that it is a potential game-changer, with the potential to become a second Marcellus.
The list of new development areas/formations also continues to expand. An excellent example is the previously obscure Memphis formation in Northern Louisiana.
Refracturing, while still at an early stage of development, also shows considerable promise. Nay-sayers, who claim it is not cost effective in some instances, are missing the point. As more experience is gained and techniques improve, there almost certainly will be instances in which it is attractive, adding yet another source of supply that can be brought on rapidly at low cost.
The Bakken, Permian Basin and Eagle Ford also are likely to become increasingly important sources of low-cost natural gas, with the Bakken evolving primarily into a gas basin, and the Permian (which yields high percentages of associated gas) becoming the primary focus of U.S. oil drilling.
The lesson of the past few years is clear: As the industry continues to gain experience with shale development, costs are likely to decline and new low-cost sources of supply will become available. Even if demand increases appreciably between now and 2020, the availability of natural gas with a break-even price below $3/MMBtu is unlikely to be exhausted. Instead, over the next 5-10 years, even steeper increases in demand probably will be required to keep prices at the level of the current forward curve on a sustained basis.
Third, natural gas demand is becoming increasingly sensitive to weather. In the past four years, the market has experienced a 1.5 Tcf swing in demand between cold (2013-14 “polar vortex”) and mild (2012-13) winters. Large swings also are possible in spring, summer and fall, as was the case this fall.
In future years, however, these swings could be much more dramatic. Partly in response to low prices, natural gas demand for space heating is expected to increase, which would exacerbate swings between cold and mild winters. As coal and nuclear plants are retired and gas-fired generating units account for a larger percentage of total generation, year-over-year swings in power sector demand for summer and shoulder months also could grow.
LNG Demand Sensitivity
The most significant factor leading to increased weather-sensitive demand, however, is the expected role of future LNG exports. Global LNG demand is highly sensitive to winter weather already and could become increasingly sensitive in the future as imported LNG used in gas-fired generating units becomes the marginal source of supply to meet variations in electricity demand in many parts of the world.
This could set up a minefield for the U.S. natural gas industry. In years in which weather conditions in the United States, Europe and Asia are reasonably close to normal and utilization rates at U.S. liquefaction facilities are high, U.S. producers are likely to be able to readily meet demand without significant upward price pressure.
However, if the following year’s winter demand is much lower than normal in much of the Northern Hemisphere (as is expected this year), year-over-year demand for U.S.-produced gas could decline by as much as 2.5 Tcf-4.0 Tcf (the equivalent of 7 Bcf/d-11 Bcf/d over 12 months), resulting in an unprecedented glut in the U.S. market, which could drive prices to historic lows.
Finally, the prospect of LNG exports, coupled with increased industrial demand and soaring exports to Mexico, is transforming U.S. pipeline infrastructure. Over the next few years, some 30 Bcf/d of new take-away capacity is expected to be built in the Northeast, enabling LNG export projects and end-users in South Texas and Mexico to tap low-cost resources in the Marcellus and Utica.
This new take-away capacity should pare basis differentials in the Northeast, increasing margins for Marcellus/Utica producers and triggering a new wave of development. At the same time, competition to serve demand in the Midwest, Southeast and Gulf Coast will intensify, pushing down prices at many hubs.
In years in which weather-driven U.S. demand and global LNG demand are reasonably strong, margins still may be acceptable. But given the magnitude of the low-cost resources available in the Northeast, the sub-$1.50/MMBtu pricing experienced in the Northeast for much of this year could spread to other parts of the country in years with mild winter and/or summer weather and soft global LNG demand.
The North American oil and gas industry plays a vital role in the U.S. and global economies. For the industry to prosper financially in a post-shale world in which supply is abundant and costs continue to decline, bold new action and a sense of urgency are required, pertaining both to 2016 and longer term.
To ride out the storm in the near term–as everyone in the industry recognizes–it is imperative to conserve cash and reduce debt. However, it is critical to not repeat the mistake of the past year and assume that prices will recover quickly. Instead, companies that are not already fully hedged should take seriously the risk that oil and gas prices could fall even lower and take decisive action to protect cash flows and core assets.
Some companies are still in strong enough positions to survive the crisis primarily by cutting capital expenditures, but many are not. Numerous companies are considering asset sales. If prices continue to crater, finding buyers may become increasingly difficult. Distressed debt exchanges, where unsecured debt is exchanged for lower amounts of secured debt, show promise. Here too, however, timely action is imperative.

ANDREW D. WEISSMAN is senior energy adviser at Haynes and Boone LLP, and chief executive officer and founder of EBW AnalyticsGroup, an energy market analysis service. During his 30-year-plus career, Weissman has provided strategic advice and counseling to independent oil and gas producers, power producers, major electric and gas utilities, hedge funds and energy traders, retail and wholesale energy marketers, equipment vendors, and large energy users, typically at the chief executive officer level. He also has played a key role in developing innovative business structures and helping to transform energy and environmental policy at the state and federal levels.
For other great articles about exploration, drilling, completions and production, subscribe to The American Oil & Gas Reporter and bookmark www.aogr.com.


