Bullish Demand Factors Underpin U.S. Gas Market As Winter 2024-25 Begins
By Dena E. Wiggins
WASHINGTON–Seasonal volatility in the natural gas market is a complex topic with enough interrelated factors to be the subject of a fairly thick book. But a picture is worth a thousand words, and to appreciate the topsy-turvy nature of the business, one need only look at the Henry Hub benchmark index over the past five winters to see the swings from one heating season to the next.
The good news is that supply and demand appear to be moving into a tighter balance as winter begins, thanks in large part to more normal forecast wintertime temperatures. The Natural Gas Supply Association’s annual Winter Outlook projects upward pricing pressure compared to the 2023-24 heating season, when Henry Hub prices averaged $2.51/MMBtu.
The report assesses five key market variables:
- Production/supply;
- Weather;
- Economic conditions;
- Demand; and,
- Storage.
Barring unexpected developments or “wildcard” scenarios, none of these variables are negative in terms of natural gas pricing pressures. Individually, the variables are expected to have either neutral or positive impacts on the gas market, collectively aligning for upward pricing pressures this winter.
A Demand Story
The key takeaway in the NGSA forecast is that the analysis is driven by solid demand fundamentals based on two critical underpinning elements:
- Ongoing incremental increases in liquefied natural gas (LNG) exports and increased usage in domestic industrial and residential/commercial markets; and
- The expected first normal winter weather in three years, stimulating residential and commercial space heating demand.
U.S. natural gas consumption continues to set records by the year, growing by 6 trillion cubic feet annually over the past decade, 10 Tcf/year over the past 20 years, and 16 Tcf/year to effectively double over the past 40 years, according to data from the U.S. Energy Information Administration. Since 2020, consumption has grown by more than 2.0 Tcf/year, reaching 32.62 Tcf in 2023.
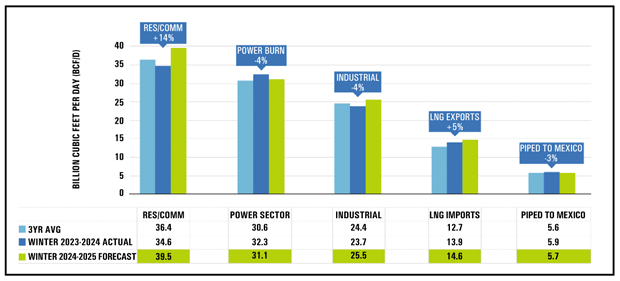
This long-term growth pattern shows no signs of abating. EIA reports that overall consumption continued to edge upward through the first three quarters of this year. The NGSA forecast parallels this trajectory, projecting 5% winter-over-winter growth to an average of 125.6 billion cubic feet a day compared to 118.9 Bcf/d last winter and an average of 117.8 Bcf/d over the past three winters, led by the residential/commercial, industrial, and LNG exports market sectors (Figure 1).
Industrial and residential/commercial demand are forecasted to reflect significantly higher pulls, assuming heating degree days near the normal 10-year average. The big year-over-year gain is largely because of last winter’s warmer-than-normal weather. With rising demand expected to place upward pressure on natural gas prices, gas-fired power demand could decrease compared to last winter’s numbers, and there may be less short-term, economically motivated switching from gas to coal.
At the same time, LNG exports are expected to grow this winter driven by competitively priced U.S. LNG availability to European and Asian markets and the potential start of commercial operations at the new Plaquemines LNG facility by the end of the new year.
LNG Exports
LNG exports are forecast to climb by 5% on a year-over-year basis during this winter’s heating season, growing from 13.9 Bcf/d to 14.8 Bcf/d thanks to expanding U.S. liquefaction capacity and strong demand in European and Asian markets.
As of the end of the third quarter, total European natural gas storage inventories were 95% of capacity, well ahead of regional goals and historical levels. However, global geopolitical tensions are driving bid support for European and Asian natural gas prices, which translates to the ongoing call on U.S. LNG.
European and Asian gas benchmarks are trading at high levels relative to the cost of delivered U.S LNG, and volumes to both Europe and Asia are expected to remain near U.S. export capacity as LNG buyers seek replacement volumes and winter progresses. A steady supply of LNG from America will be essential to maintaining reliability throughout the winter months. Europe experienced its warmest average temperatures in 175 years from December 2023 to February 2024, but a more typical winter this year could quickly draw down EU storage levels.
Consequently, competitive prices and healthy netbacks are expected to fuel a thriving market for U.S. LNG. Buyers in both European and Asian markets will continue to compete to attract U.S. LNG, especially if heating degree days average normal or stronger-than-normal this winter in those regions.
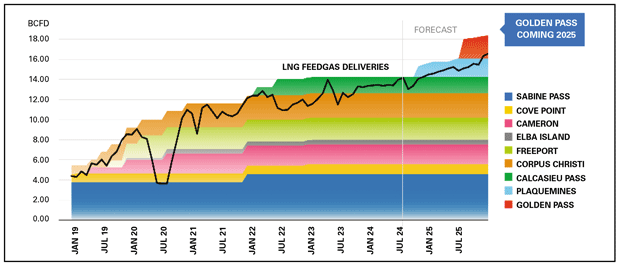
With the domestic LNG market continuing to experience an era of tremendous growth in export capacity, U.S. feedgas demand is projected to average 14.5 Bcf/d this winter, which would be an increase of ~0.75 Bcf/d on a year-over-year basis. Figure 2 shows actual and forecast U.S. LNG export capacity versus feedgas deliveries from 2019 through the end of 2025.
The imminent commencement of the Plaquemines LNG facility in Louisiana will give the United Stated eight major LNG export terminals. Sometime next summer, Golden Pass is expected to become the ninth such U.S. facility in operation. Both Mexican and Canadian LNG projects are scheduled to start up over the next few years, which only support a stronger North American LNG outlook as new projects approach commercial online dates across the continent.
Pipeline natural gas exports into Mexico have been growing in recent years, and reached a record level in 2024. U.S. exports to Mexico are expected to average 5.75 Bcf/d during winter 2024-25, which would essentially be flat from last winter’s average volume. However, more gains are expected over the next few years with the construction of new pipelines, LNG terminals, gas-fired power plants, and industrial demand gains in Mexico.
Industrial, Electric Sectors
According to the U.S. Federal Reserve, domestic industrial capacity utilization averaged 78% over the first six months of 2024, which was a 1.5% decrease compared with the same period in 2023. Industrial capacity utilization is a key indicator of energy use by existing facilities, but 19 industrial-scale projects were expected to come online between 2024 and 2028, representing nearly 1.0 Bcf/d in new demand and a total investment of $39 billion.
Those projects include seven petrochemical and five fertilizer new-build plants, as well as the expansions of four existing petrochemical and one fertilizer facility. One new steel and one new gas-to-liquids plant are also on the schedule to begin operations by 2028. Assuming all 19 of these projects are completed by year-end 2028, the U.S. industrial market would have added a total investment of $135 billion worth of projects and 2.75 Bcf/d of incremental demand load.
Overall, industrial sector demand for natural gas is expected to be up 7% winter-over-winter, from 13.9 Bcf/d to 14.8 Bcf/d, and continue to build on the three-year average of 12.7 Bcf/d.
A silver lining to low gas prices in 2024 was the fact that they opened the door to demand gains in the price-sensitive power generation sector. The suppressed price curve incentivized power burn and displaced coal-fired generation during the majority of last summer’s cooling season, with the exception of some short-term coal generation growth caused by spiking electric demand during record heat waves. In contrast, renewable generation did not make as great of an impact on power sector demand because of underperforming renewable generation requiring gas- and coal-fired generation to support reliability needs during periods of peak electricity demand.
A strong response to last summer’s robust demand from both coal- and gas-fired power plants did not affect power prices significantly, with power prices averaging at a lower level than market forwards were trading.
Anticipated stronger natural gas prices are forecast to result in a slight decrease this winter in power generation demand compared with winter 2023-24, from 32.3 Bcf/d to 31.1 Bcf/d, but still above the three-year average of 30.6 Bcf/d.
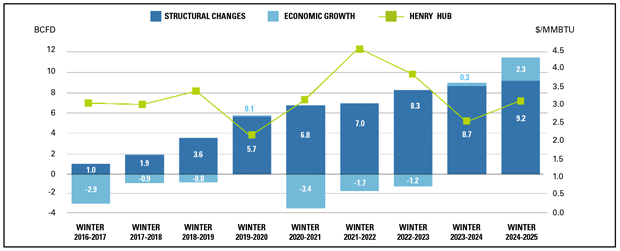
Comparing winter 2024-25 capacity to 2015 baseline capacity, the United States has seen a structural gain of 9.2 Bcf/d from new gas-fired generation and a net gain of 2.3 Bcf/d from temporary, economically motivated dispatching of gas-fired generation plants (Figure 3).
FIGURE 3
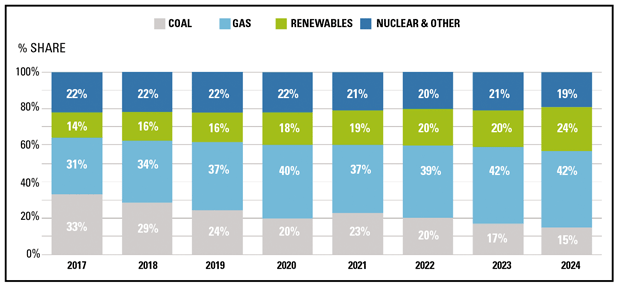
Growth of Natural Gas in U.S. Fuel Mix
Source: U.S. Energy Information Administration (EIA) Short Term Outlook, July 2024
FIGURE 4
Gas-Fired Generation Structural Growth versus Economic Switching
Source: Energy Ventures Analysis
Natural gas holds the dominant share in the electric generation fuel mix, now accounting for 42% of the total market. Coal’s share has shrunk by more than half since 2017 to 19%, while renewables’ has expanded from 14% to 24% over that same period. Ongoing coal generation retirements are projected to continue to limit the ability of power markets to switch from natural gas to coal in response to price signals. Since 2018, U.S. generators have retired 66 gigawatts of coal capacity while adding 36 GW of gas-fired capacity and 136 GW of new wind, solar, and battery storage resources (Figure 4). Looking beyond this winter, power demand growth further will be spurred by fast-spreading data demand centers.
Although the November 1-to-March 30 heating season got off to an unseasonably warm start with temperatures in the major gas-consuming regions well above normal, EIA estimates that the market consumed an average of 106.9 Bcf/d in the second week of November, not far off the 107.5 Bcf/d average for the same week the year prior when temperatures were more seasonable across U.S. consuming markets, even though last winter would turn out to be the warmest in 130 years.
NGSA Outlook modeling assumes “10-year normal weather” based on National Oceanic & Atmospheric Administration forecasts. In the wake of last winter’s warmer-than-normal heating season and resultingly lower heating demand, tighter supply/demand are expected balances this winter, despite the expectation for production gains and relatively flat power consumption.
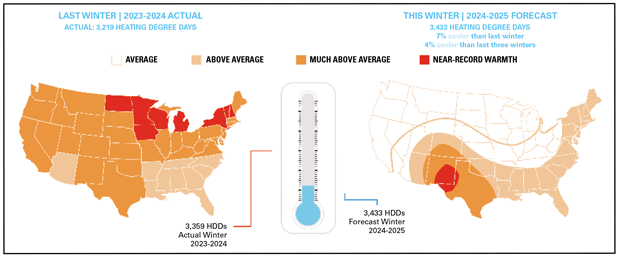
More typical wintertime temperatures mean more heating degree days and stronger space heating demand. NGSA’s report projects 7% cooler temperatures than last winter and 4% cooler than the three-year wintertime average, resulting in 3.433 heating degree days this winter compared to 3,219 heating degree days last winter (Figure 5).
Driven by colder temperatures, demand in the residential and commercial sectors is estimated to be 14% higher this winter at 39.5 Bcf/d compared with 34.6 Bcf/d last winter and 36.4 Bcf/d average over the past three winters.
Looking at the supply side, start-of-winter storage inventories are 6% higher year-over-year, but stronger demand is expected to lead to average daily storage withdrawals increasing from 9.8 Bcf last winter to 14.0 Bcf, whittling the storage overhang down toward the five-year average by the end of March 2025. The end result is an overall neutral impact from storage on natural gas price pressures this winter.
Likewise, although U.S. gas production is expected to reach a record 104.5 Bcf/d this winter, up from 103.2 Bcf/d last year and from a three-year average of 99.9 Bcf/d, higher demand should more than offset the incremental supply additions with little effect on gas price pressures. Growth in associated gas production in the Permian Basin is expected to continue to outpace dry gas and associated gas increases in all other U.S. basins combined.
Overall, NGSA’s annual report once again demonstrates the critical importance of natural gas in the domestic and global energy mixes, and underscores the fact that U.S. producers are rising to the challenge of meeting strong winter demand for natural gas both at home and abroad. r
Editor’s Note: The preceding article was adapted from the Natural Gas Supply Association’s 24th annual Winter Outlook report, which was developed using data from Energy Ventures Analysis Inc. NGSA does not project wholesale or retail market prices.
DENA E. WIGGINS is president and CEO of the Natural Gas Supply Association, leading NGSA’s efforts to advance the natural gas industry’s economic and environmental agenda with member companies, regulators, legislators, and other key stakeholders. Wiggins has spent much of her professional career engaged in representing producer/marketers before the Federal Energy Regulatory Commission, and has been involved in every major natural gas rulemaking since Order No. 436. She is deeply involved in the National Association of Regulatory Utility Commissioners, particularly the Committee on Gas, where she has advocated for the benefits of natural gas in a lower-carbon energy future. Prior to NGSA, Wiggins was a partner in the law firm of Ballard Spahr and served as general counsel to the Process Gas Consumers Group. She holds a B.A, from the University of Richmond and a J.D. from Georgetown University Law Center.
For other great articles about exploration, drilling, completions and production, subscribe to The American Oil & Gas Reporter and bookmark www.aogr.com.


