Conventional Oil Drilling Strength May Be Hiding In Unconventional Activity Trough
By Bill Campbell
For five years, the nation struggled to recover from the financial crisis of 2008, only to find Congress divided on the economic implications of the 2012 year-end “fiscal cliff,” as well as the impending 2013 debt ceiling.
In the same span, the upstream oil and gas industry remained united in its quest to measure the “sleeping giant” of America’s vast oil and gas resource base. Work continued in well-known game-changers ranging from the Barnett to the Haynesville and Utica/Marcellus shales, to the oily Bakken and Eagle Ford, even while companies put new play potential in such areas as the Smackover Brown Dense on the “what if” table.
So what lies ahead for independent oil and gas operators, and the service and supply companies that make their continued growth possible? To find out, The American Oil & Gas Reporter examined the trend lines from surveys of 2013 expectations along with its own annual Survey of Independent Operators.
In The News
Unconventional resource development, powered by large horizontal wells and multistage hydraulic fracturing, has grabbed America’s attention and is driving the headlines in the domestic oil and gas industry.
And rightly so. Consider:
- The Texas Railroad Commission reports crude oil production from the nine fields that comprise the majority of the Eagle Ford Shale jumped from 183,261 barrels a day in October 2011 to 323,098 bbl/d in October 2012.
- Nearly as impressive, Bakken production went from 488,066 bbl/d in October 2011 to 747,239 bbl/d in October 2012, and has increased 118 percent in the past two years, according to the North Dakota Department of Mineral Resources.
- Driven largely by horizontal completions in multiple horizons, production from the venerable Permian Basin, which had fallen to 870,000 bbl/d in 2007, zoomed back to 1.2 million barrels a day last year (AOGR, December 2012, pg. 150).
- Meanwhile, an Associated Press report says Marcellus Shale wells in Pennsylvania and West Virginia were producing 7 billion cubic feet of natural gas a day in December, comprising 25 percent of U.S. shale gas production and double their volume from a year earlier.
There is some speculation, however, about whether all the activity in red-hot shale plays can continue at such a brisk pace. The Baker Hughes Rig Count, which peaked at 2,026 in early November 2011, continued a slide that grew more pronounced over the latter part of the year, settling at 1,763 in the Dec. 28 count.
One possible explanation for the fourth quarter “trough” in activity is offered by Barclays Capital Inc. in its Global 2013 E&P Spending Outlook. Based on its sampling of the budgets of U.S. independent operators, Barclays estimates companies had spent 80-85 percent of their planned 2012 budgets by the end of September, leaving less than one-fifth of their full-year capital spending for the fourth quarter. With U.S. upstream spending dominated by independents, Barclays suggests the “front-loaded” spending pattern of these companies was largely responsible for the late-year dip in drilling.
“We anticipate a relatively short-lived pullback . . . 2013 U.S. budget forecasts for each company in our sample imply average quarterly spending rates at levels considerably higher than (in the fourth quarter of 2012),” Barclays assesses.
Noting that it sees many of the issues constraining North American capital spending as transitory, Barclays projects a modest year-to-year increase in upstream spending for 2013. It reports that the 300 upstream companies it interviewed expect their exploration, drilling and production spending “will be constrained by lower natural gas prices, modestly reduced West Texas Intermediate prices . . . (and) lower natural gas liquids prices” among other factors, rising 0.7 percent in 2013.
However, after North American capital spending increased by 27 percent in 2010, 31 percent in 2011, and 4 percent in 2012, the Barclays survey states, “Although North America has historically been a short-cycle market characterized by volatile swings in activity, the shift toward oil-directed and liquids-rich activity has significantly reduced the cyclicality in the region and will result in more consistent spending levels, in our view. Long-term and across cycles, we expect spending growth in North America to remain in the high single-digits through at least 2016.”
For its part, the U.S. Energy Information Administration, in its December 2012 Short-Term Energy Outlook, projects U.S. crude oil production, which rose an estimated 13.5 percent from 2011 to 2012, will increase by 10.0 percent in 2013, while the rate of increase in U.S. natural gas output will cool from 4.3 percent in 2012 to 0.5 percent in 2013.
Four Straight Years
But there is a segment of the U.S. oil and gas industry that may not be reflected in surveys of larger producers and for whom flat budget projections may not apply: small independents drilling largely vertical wells in conventional oil and gas formations.
Those companies comprise a large percentage of the respondents to The American Oil & Gas Reporter’s annual Survey of Independent Operators, and they say they expect another banner year in 2013, drilling 26.4 percent more wells this year than last.
AOGR mails its Survey of Independent Operators annually in November to oil and gas producers nationwide, selected at random from the magazine’s circulation list. No attempt is made to identify survey respondents, and AOGR staff compile and analyze the data. The Survey of Independent Operators does not account for dry holes, but merely asks operators what the intended target is when a well is spudded.
Respondents to the 2013 survey drilled an average of 7.6 wells in 2012, of which 80.5 percent targeted convention oil formations and 80.8 percent were vertical. Those respondents say they plan to drill an average of 9.7 wells in 2013, a 26.4 percent increase.
This is the fourth straight year that respondents to the Survey of Independent Operators are predicting double-digit increases in drilling, following projections of 38.2, 35.3 and 37.6 percent increases in 2010, ’11 and ’12, respectively.
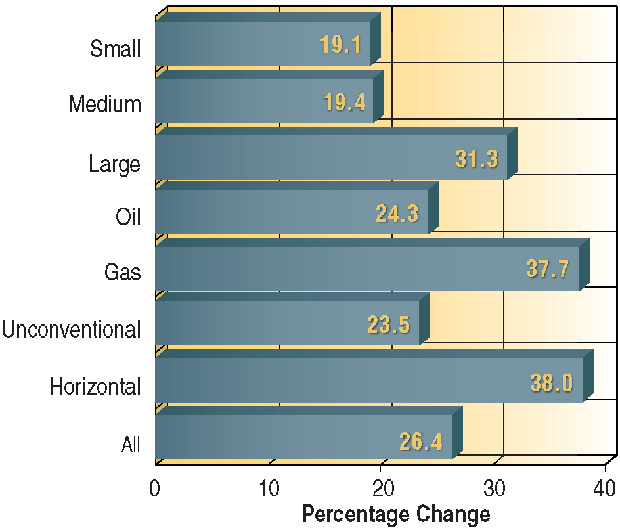
Interestingly, even though survey respondents’ drilling programs are heavily weighted toward oil–conventional and unconventional oil wells account for 93.1 percent of respondents’ 2012 drilling programs and 93.7 percent of their planned 2013 programs–those that do some natural gas drilling have higher expectations than respondents drilling only oil wells. Those that did some natural gas drilling in 2012, or expect to in 2013, say they will drill 37.7 percent more wells this year than last, compared with a 24.3 percent increase projected by those drilling oil wells only (Figure 1).
FIGURE 1
Change in Operators’ Planned 2013 Drilling
Compared with 2012 Actual Drilling
Respondents designated as “Small” are those that plan to drill 0-4 wells in 2013. Respondents designated as “Medium” plan to drill 5-10 wells this year, while those designated as “Large” plan to drill more than 10. All respondents that drilled any natural gas wells in 2012 or indicate they plan to drill any natural gas wells in 2013 are included in the “Gas” category, while those designated as “Oil” drilled and plan to drill only oil wells. All respondents that reported drilling any horizontal wells in 2012 or that plan to drill any horizontal wells in 2013 are included in the “Horizontal” category. Likewise, those included in the “Unconventional” category drilled at least one unconventional oil or gas well in 2012 and/or indicate plans to do so in 2013.
That expectation may reflect optimism over an upward-trending December New York Mercantile Exchange natural gas strip price in October and November. The NYMEX natural gas strip ended November at $3.82 an MMBtu, up considerably from the low point in spring 2012, when the NYMEX futures price dipped below $2.00 an MMBtu.
Much has been written about the potential implications of increased demand for natural gas, from its increased use in power generation to the groundswell in compressed natural gas fleet vehicles. Is there optimism in the C-suite of the nation’s independent operators that increased demand coupled with depletion may hold a ray of sunshine on the natural gas side of the fence?
While oil and natural gas liquids targets have underpinned domestic drilling activity levels for the last several years, could there be a sign in the Baker Hughes rig counts in the last two months of 2012? While the oil rig count was trending downward, it was up for natural gas in five of the last nine weeks of the year, for a net gain of 15 rigs.
Getting back to AOGR’s Survey of Independent Operators, the “larger operator” category of respondents (those who expect to drill more than 10 wells in 2013) have higher expectations for 2013 than do the “small” (0-4 wells in 2013) and “medium” (5-10 wells in 2013) categories of survey respondents. Large operators are projecting a 31.3 percent increase in drilling, while small and medium operators report 19.1 and 19.4 percent increases, respectively.
Perhaps signaling that the U.S. shale boom still has plenty of room to run, survey respondents who do some unconventional drilling project a 23.5 percent increase in 2013 wells, while those who do some horizontal drilling predict a 38.0 percent increase.
Drilling, Spending Plans
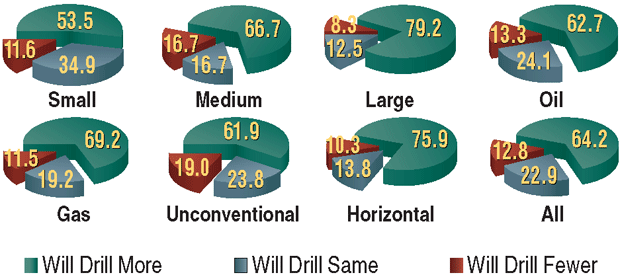
In line with the projected increases in wells drilled, a greater percentage of large operators plan increased drilling than smaller operators, and more respondents who drill some natural gas wells say they will drill more. Nearly four in five (79.2 percent) of the large category of respondents indicate they will drill more wells this year and another 12.5 percent say they will drill the same number (Figure 2). This compares with 66.7 percent of the medium category and 53.5 percent of the small category that say they plan increased drilling.
Likewise, 69.2 percent of respondents who do some natural gas-directed drilling say they will drill more wells this year, compared with 62.7 percent of those drilling oil wells only. Three-fourths of respondents who do some horizontal drilling say they will drill more wells this year, along with 61.9 percent of those who target some unconventional formations. Overall, 64.2 percent of survey respondents say they will drill more wells in 2013 and 22.9 percent say they will drill the same number they drilled in 2012.
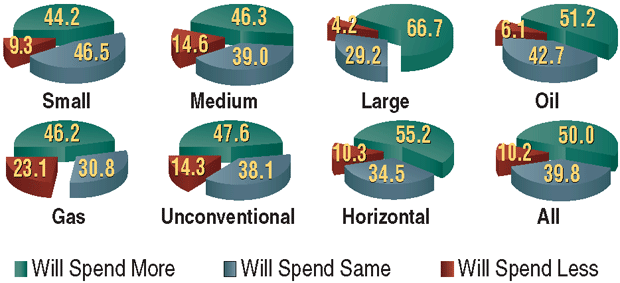
The size advantage holds for respondents that anticipate larger 2013 drilling budgets than they had in 2012, but not so for the oil and gas categories. Figure 3 shows that 66.7 percent of the large category of respondents say they expect to spend more drilling wells this year than last, while another 29.2 percent expect to spend the same amount. This compares with 46.3 percent of the medium category of respondents and 44.2 percent of the small category that anticipate larger 2013 drilling budgets.
But when it comes to the flavor of hydrocarbon, those focused on oil well drilling have higher spending expectations, with 51.2 percent of oil-only drillers anticipating bigger budgets this year, compared with 46.2 percent of companies that drill some gas wells.
Among those drilling some unconventional wells, 47.6 percent say they expect larger budgets in 2013, although another 38.1 percent say they will spend the same amount as in 2012, while 55.2 percent of respondents that do some horizontal drilling report increased spending plans.
Overall, exactly half of survey respondents say they expect to spend more drilling wells in 2013 than they did in 2012, while another 39.8 percent say they will spend the same and 10.2 percent say they will spend less.
Price Sensitivity
Similar to the Barclays survey, respondents to the AOGR Survey of Independent Operators are basing their 2013 drilling plans on a WTI spot price at Cushing, Ok., of $83.77 a barrel. Barclays says its survey participants are basing their 2013 capital budgets on an average WTI price of $85 a barrel. AOGR survey respondents are projecting a 2013 natural gas price of $3.87 an Mcf, while Barclays participants expect a Henry Hub price of $3.47 an MMBtu.
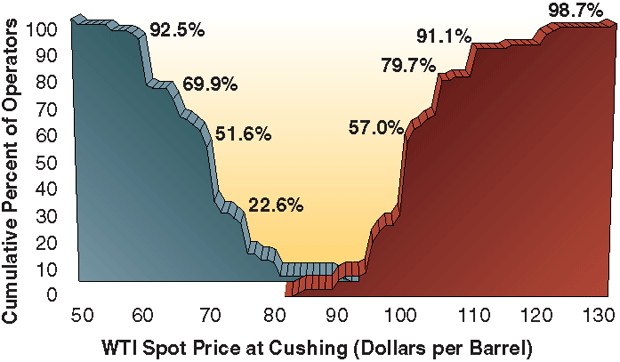
AOGR asks its survey respondents at what oil/gas price they would either increase or decrease their anticipated 2013 drilling programs. At $95 a barrel, 20.3 percent of survey respondents say they would drill more wells, while 24.1 percent would do so at $96 (Figure 4A). The next big jump comes at $100 a barrel, when 57.0 percent say they would increase drilling, followed by 79.9 percent at $105 and 91.1 percent at $110.
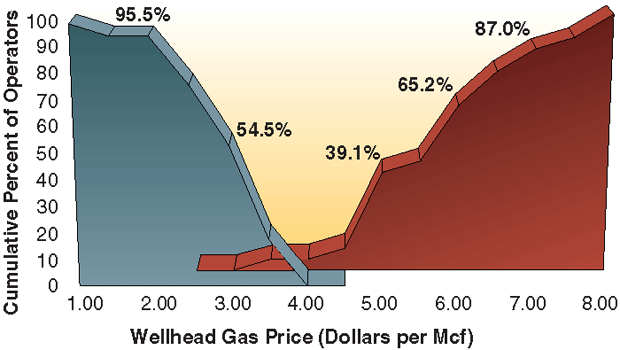
FIGURE 4A
Natural Gas Prices at Which Operators
Would Alter 2013 Drilling Plans
Percentages in Figures 4A and 4B represent the cumulative total of survey respondents that indicate they would have altered their 2013 drilling plans by the time the wellhead natural gas price (Figure 4A) or the spot price for West Texas Intermediate crude oil delivered at Cushing, Ok. (Figure 4B), reached the indicated amount. Prices at which drilling would decrease are plotted to the left of the graphs in downward curves; prices at which drilling would increase are plotted to the right of the graphs in upward curves.
Going the other way, 22.6 percent of AOGR survey respondents say they will reduce the number of wells they drill this year if crude oil prices fall to $75 a barrel. That percentage jumps to 51.6 percent at $70, hits 69.9 percent at $65 and zooms to 92.5 percent at $60.
Barclays reports the average oil price at which its survey participants would increase capital budgets is $101 a barrel, while the average price at which they would decrease budgets is $67.
Between $5.00 and $6.00 an Mcf is the price range that would get more natural gas rigs turning to the right, according to the Survey of Independent Operators. While only 8.7 percent of AOGR respondents say they would drill more wells at $4.50 an Mcf for gas, 39.1 percent would do so at $5.00, 43.5 percent would drill more at $5.50, and 65.2 percent would increase their drilling plans at $6.00 an Mcf (Figure 4B). The percentages of survey respondents who say they would drill more wells continues to rise to 78.3 at $6.50 an Mcf and to 87.0 at $7.00 an Mcf.
FIGURE 4B
Crude Oil Prices at Which Operators
Would Alter 2013 Drilling Plans
Percentages in Figures 4A and 4B represent the cumulative total of survey respondents that indicate they would have altered their 2013 drilling plans by the time the wellhead natural gas price (Figure 4A) or the spot price for West Texas Intermediate crude oil delivered at Cushing, Ok. (Figure 4B), reached the indicated amount. Prices at which drilling would decrease are plotted to the left of the graphs in downward curves; prices at which drilling would increase are plotted to the right of the graphs in upward curves.
Indicating relatively little tolerance for falling natural gas prices, 18.2 percent of AOGR survey respondents say they will drill fewer wells if gas prices drop to $3.50 an Mcf, and 54.5 percent will drill fewer at $3.00. At $2.50 an Mcf, 77.3 percent of AOGR survey respondents will drill fewer wells, and 95.5 percent will have cut back by the time gas prices drop to $2.00 an Mcf.
Barclays reports that $2.85 an MMBtu is the average Henry Hub price at which its survey participants would reduce their drilling budgets, while $4.68 an MMBtu is the average price at which participants would raise their budgets.
Government Concerns
Another area where the Survey of Independent Operators somewhat jibes with other analysts is the outside factors that could affect respondents’ drilling plans.
In its 2013 BDO Energy Outlook Survey, BDO USA LLP presents the opinions of 100 chief financial officers at U.S. oil and natural gas exploration and production companies. In preliminary results released in November, BDO reports, “Government regulation continues to be on the minds of industry leaders, with 63 percent reporting that state and/or federal regulations have resulted in delays or terminations of projects during the past 12 months. As the next Congress convenes, 36 percent fear more restrictive government regulation in 2013, followed by 28 percent who think tax proposals targeting the energy sector . . . lie ahead.”
The Survey of Independent Operators allows respondents to make voluntary comments. Of the approximately one-fifth of total survey respondents who provided comments, 45 percent worried about the likelihood of increased taxes or regulations. Of those, half express concern about increased federal taxation, with 30 percent specifically mentioning loss of percentage depletion and intangible drilling costs.
As one survey respondent says, “If depletion and depreciation are eliminated for independent oil operations, we may drill zero!”
Another survey respondent writes, “It all depends on what (President) Obama and Congress do,” while a third observes, “This company has survived more than 100 years (with their) prevailing ups and downs, but a clueless and even malicious Obama energy policy may well shut us down.”
Another 23 percent of respondents’ comments note the importance of oil and gas prices to independent producers’ drilling plans, especially indicating concern about low natural gas prices.
Barclay’s Global 2013 E&P Spending Outlook suggests that concern may be overstated. In its big picture of global activity drawn from its survey group, Barclays says the $644 billion earmarked for exploration and production this year will set a record, with projected spending up 7 percent from $604 billion in 2012.
But when noting the survey group is basing its spending plans on oil prices of $98 Brent and $85 WTI, and U.S. natural gas prices of $3.47, the company adds, “These projections suggest our early look at 2013 spending levels may underestimate total spending levels.”
Rounding out assessments for 2013 are themes recognized in Wood Mackenzie’s Horizons 2013, in which the executive summary notes, “Oil and gas companies continue to invest in new supply despite the threat of further downward price movements; an energy-independent North America could be the result, if infrastructure hurdles can be overcome.”
For other great articles about exploration, drilling, completions and production, subscribe to The American Oil & Gas Reporter and bookmark www.aogr.com.


