Independent Producers Expect To ‘Keep On’ Drilling During 2011
By Bill Campbell
It’s not quite 2008 again, but 2011 could come darn close.
In 2008, U.S. oil and gas producers and operators drilled 56,176 crude oil and natural gas wells by the U.S. Energy Information Administration’s count–the most in any single year since the infamous oil price collapse of 1986. But oil and gas prices dropped in 2009, and completions fell with them to 34,631, a 37.6 percent decline.
In the fall of that year, companies responding to The American Oil & Gas Reporter’s Survey of Independent Operators predicted they would boost their drilling rates in 2010 by 38.2 percent (AOGR, January 2010, pg. 55). According to EIA, through the first 10 months of this year, U.S. drillers had delivered on about two-thirds of that pledge, boosting 2010 drilling rates by 24.4 percent over the same 10 months of 2009. That rate projects to a year-end well count of around 43,100.
Respondents to AOGR’s 2011 Survey of Independent Operators indicate another healthy increase in drilling rates for the year ahead, this time projecting a 35.3 percent hike. Utilizing the same two-thirds “delivery rate” experienced in 2010 extrapolates to a total 2011 well count in the neighborhood of 52,800–the second largest post-1986 completion rate.
It appears that in 2011, U.S. independents are going to “keep on keeping on.”
The American Oil & Gas Reporter mails its Survey of Independent Operators annually in late fall to oil and gas producers nationwide, selected at random from the magazine’s circulation list. No attempt is made to identify survey respondents, and AOGR staff compile and analyze the data. The Survey of Independent Operators does not account for dry holes, but merely asks operators what the intended target is when a well is spudded.
FIGURE 1
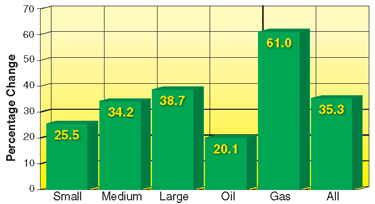
Change in Operators’ Planned 2011 Drilling Compared with 2010 Actual Drilling
Operators designated as small are those who plan to drill 0-4 wells in 2011. Operators designated as medium plan to drill 5-14 wells this year, while those designated as large plan to drill 15 or more wells. Operators designated as oil targeted oil on more than half their 2010 wells, while those designated as gas targeted natural gas on more than half of their 2010 wells.
For the second consecutive year, survey respondents are predicting better than a one-third increase in the number of wells drilled, following last year’s projection of a 38.2 percent increase in drilling with a 35.3 percent increase this year (Figure 1). Interestingly, “gas-well drillers”–those that targeted natural gas with more than half their 2010 wells–are the most optimistic, projecting a 61.0 percent increase in drilling. This compares with a 20.1 percent increase predicted by those who targeted crude oil with more than half their 2010 wells (“oil-well drillers”).
When it comes to size, bigger is better in the 2011 survey. Respondents categorized as “large drillers”–those who anticipate drilling 15 or more wells in 2011–project a 38.7 percent increase in 2011 drilling over 2010, compared with 34.2 percent for “medium drillers” (5-14 wells in 2011) and a 25.5 percent increase by “small drillers” (four or fewer wells in 2011).
Like Unconventional Gas
For the first time, AOGR in its 2011 survey asked respondents to differentiate between conventional and unconventional oil and gas targets. While there is no doubt 2010 was an “oily” year, as will be 2011, the responses may shed some light on why gas-well and large drillers are the most optimistic groups. The answer is shale gas.
Survey responses indicate that unconventional oil remains in its infancy. Unconventional oil comprised 10.4 percent of 2010 wells and is projected to comprise 9.2 percent of 2011 wells. But unconventional gas wells, which accounted for 19.8 percent of 2010 drilling, leap to 25.7 percent of all wells in 2011. Most of the shift toward unconventional gas drilling comes at the expense of conventional gas wells, which decline from 20.0 percent of the total in 2010 to 16.1 percent in 2011, while conventional oil targets stay nearly the same at 49.7 percent in 2010 and 49.0 percent in 2011.
The shift toward unconventional gas is most pronounced in the large driller category of survey respondents, which says it will increase its unconventional gas well count from 26.0 percent last year to 34.3 percent this year, while letting its conventional gas targets slide from 20.7 percent of total wells to 15.2 percent.
At the other extreme, small drillers, who drill very few unconventional gas or oil wells, say they will emphasize conventional oil drilling this year, raising the percentage of their wells that target conventional oil formations from 66.3 percent in 2010 to 72.2 percent in 2011.
But small drillers account for only 10 percent of the total wells drilled by survey respondents, compared with nearly two-thirds for the large drillers. Hence, the increased enthusiasm for natural gas–and especially unconventional natural gas–drilling reflected in the 2011 survey results.
Horizontal Drilling
Also for the first time, the 2011 survey asked what percentage of respondents’ wells were horizontal. Not surprisingly, the preponderance of horizontal drilling is associated with gas. Gas well drillers report drilling laterally on 49.3 percent of their 2010 wells and say they will go horizontal with 57.3 percent of their 2011 well bores, compared with 19.8 percent horizontals in 2010 and 17.0 percent in 2011 for the oil drillers category. Again, large drillers are much more likely to drill horizontally, going lateral with 40.1 percent of their 2010 wells and 43.6 percent in 2011. That compares with 4.3 percent 2010 horizontals and 9.4 percent 2011 horizontals for small drillers, and 11.2 and 17.4 percent in 2010 and ’11, respectively, for medium drillers.
For all respondents, horizontal wells comprise 30.0 percent of 2010 wells and 34.7 percent of planned 2011 wells.
The average survey respondent drilled 7.6 wells in 2010 and plans 10.2 in 2011. Small drillers go from 1.9 wells last year to 2.3 this year; medium drillers go from 5.3 to 7.1; large from 23.3 to 32.3; oil drillers go from 7.3 to 8.8; and gas drillers go from an average of 9.5 wells in 2010 to 15.3 in 2011.
Average depth of 2010 wells was 7,693 feet, and is projected to go to 7,720 in 2011. Average lateral lengths expand from 3,925 feet last year to 4,370 feet this year. The mix of exploratory to developmental drilling stays fairly constant at 15.2 percent wildcats and 84.8 percent developmental in 2010, going to 14.3 percent and 85.7 percent, respectively, this year.
Drilling, Spending Plans
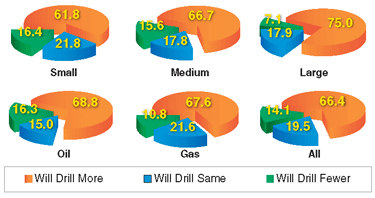
Two-thirds of respondents to the 2011 Survey of Independent Operators say they expect to drill more wells this year than they did last year (Figure 2). Another 19.5 percent say they will drill the same number, while 14.1 percent expect to drill fewer.
Here, the difference is minimal between oil- and gas-well drillers, with 68.8 percent of the oil category projecting an increase, compared with 67.6 percent of the gas category. However, large drillers remain the most optimistic, with 75.0 percent planning more wells this year, compared with 66.7 percent of medium drillers and 61.8 percent of small drillers who say they will drill more this year.
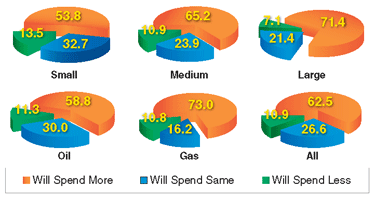
When it comes to drilling budgets, however, gas drillers are the most likely to plan an increase, perhaps because of the preponderance of horizontal and unconventional wells drilled by this category. Nearly three-fourths (73.0 percent) of gas drillers are expecting to spend more this year, compared with 58.8 percent of oil drillers (Figure 3).
The large driller category continues to be the most aggressive among the size groupings, with 71.4 percent of large drillers anticipating bigger drilling budgets in 2011, compared with 65.2 percent of medium drillers and 61.8 percent of small drillers.
Among all survey respondents, 62.5 percent say they will increase their drilling budgets in 2011, 26.6 percent expect them to stay the same, and 10.9 percent will spend less.
Oil And Gas Prices
Ultimately, oil and gas prices determine the level of independent producers’ drilling, and respondents to the 2011 Survey of Independent Operators say they are basing this year’s drilling plans on a crude oil price of $74.67 a barrel (West Texas Intermediate spot price at Cushing, Ok.) and a natural gas price of $4.52 an Mcf.
Price projections are fairly consistent across respondent categories. They range from a high for both oil and gas prices among small drillers of $75.58 a barrel and $4.63 an Mcf to a low of $73.16 a barrel among gas well drillers and $4.41 an Mcf among large drillers.
AOGR assesses respondents’ sensitivity to price fluctuations by also asking what price would cause them to change their 2011 drilling plans. Again not surprisingly, given the disparity in Btu-equivalent prices for oil and gas, respondents indicate much less tolerance for any drop in natural gas prices than they have for lower crude oil prices.
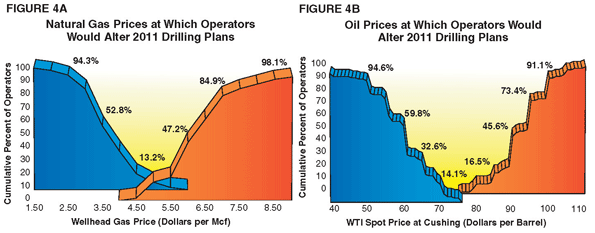
Nearly a third (32.1 percent) of respondents say they will reduce their planned 2011 drilling if gas prices drop to $4.00 an Mcf, and 52.8 percent say they will cut back at $3.50 an Mcf (Figure 4A). If gas prices drop to $3.00 an Mcf, 83.0 percent of survey respondents say they will drill fewer wells, while 94.3 percent will cut back at $2.50 gas.
Percentages in Figures 4A and 4B represent the cumulative total of survey respondents who indicate they would have altered their 2011 drilling plans by the time the wellhead natural gas price (Figure 4A) or the spot price for West Texas Intermediate crude oil delivered at Cushing, Ok. (Figure 4B), reached the indicated amount. Prices at which drilling would decrease are plotted to the left of the graphs in downward curves; prices at which drilling would increase are plotted to the right of the graphs in upward curves.
On the upside, anything above $6.00 an Mcf puts more rigs to work. While only 18.9 percent of respondents indicate they would drill more wells at a natural gas price of $5.50 an Mcf, 47.2 percent would drill more at $6.00, and 66.0 percent would increase drilling at $6.50. By the time gas prices reach $7.00, 84.9 percent of survey respondents say they will drill more, and 90.6 percent would be more active at $8.00 gas.
Crude oil prices, meanwhile, would have to drop well below $70 a barrel to elicit much of a response in 2011 drilling plans. At $70 a barrel, only 14.1 percent of respondents indicate they would drill fewer wells (Figure 4B). That percentage climbs to 32.6 at $65 oil, then balloons to 59.8 percent at $60. By the time oil prices fall to $55 a barrel, 80.4 percent of survey respondents say they would reduce 2011 drilling plans, and 94.6 percent would cut back at $50 oil.
Going the other way, $90, $95 and $100 are markers that excite oil well drilling. Although only 16.5 percent of respondents say they will drill more wells at $85 oil, 45.6 percent indicate they will put more rigs to work if oil reaches $90 a barrel. That jumps to 73.4 percent at $95 oil, and rises to 91.1 percent at $100 oil.
Production Levels
Despite last year’s increase in overall drilling activity, only 24.8 percent of survey respondents report higher third-quarter 2010 natural gas production than at the same time in 2009. In fact, 44.8 percent of respondents report their gas production at the time of the survey was less than it was one year earlier, and 30.5 percent say their gas production remained flat from a year ago.
Perhaps reflecting the pronounced and ongoing shift in weekly U.S. rig counts away from gas in favor of oil drilling, the trend was opposite for crude oil production, with 43.1 percent of all survey respondents saying their third-quarter 2010 production exceeded third-quarter 2009. Another 22.8 percent report oil production unchanged, while 34.1 percent report oil production down year on year.
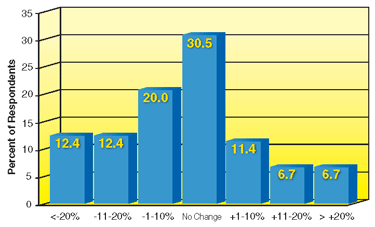
As to how much their gas production varied from a year earlier, 12.4 percent of survey respondents say production was down 20 percent or more from a year earlier, another 12.4 percent were producing 11-20 percent less, and 20.0 percent say they were producing 1-10 percent less gas (Figure 5). On the flip side, 11.4 percent report their gas production was up 1-10 percent at the time of the survey, while 6.7 percent each report gas production up 11-20 percent or more than 20 percent.
The gas-well driller category bucked the overall trend of declining gas production, with 42.2 percent reporting higher 2010 gas production, compared with 34.2 percent who say their 2010 gas production fell. Looking at volumes, 13.2 percent of gas drillers say their gas production was up more than 20 percent, 15.8 percent report 11-20 percent growth, and another 13.2 percent report a 1-10 percent increase.
The large driller category was evenly balanced with 42.3 percent reporting increased gas production in 2010 and another 42.3 percent reporting less gas production. Among the other respondent categories, 52.5 percent of small drillers reported 2010 gas production was less than 2009, 50.0 percent of oil well drillers reported declining gas production, and 36.9 percent of medium drillers reported less gas production. Reporting greater 2010 gas production for those three categories were 15.0 percent small, 13.7 percent oil, and 23.7 percent medium.
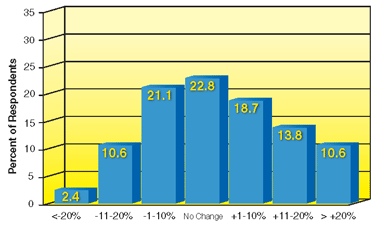
Looking at crude oil production (Figure 6), 10.6 percent of survey respondents put their 2010 production more than 20 percent ahead of 2009, 13.8 percent report oil production up 11-20 percent, and 18.7 percent say it rose 1-10 percent. Meanwhile, 2.4 percent of respondents say their oil production declined more than 20 percent, 10.6 percent report oil production down 11-20 percent, and 21.1 percent say oil production slipped 1-10 percent.
The large and oil-well driller categories of survey respondents report increased oil production most frequently. Exactly half of oil well drillers report increased oil production in 2010, while 32.0 percent of oil drillers say their oil production fell. Meanwhile, 62.9 percent of large drillers say their oil production was up, while only 22.2 percent report lower oil production in 2010 than in 2009.
For the remaining respondent categories, the oil production replies are 30.0 percent up and 44.0 percent down for small drillers, 45.4 percent up and 29.5 percent down for medium drillers, and 30.6 percent up and 33.3 percent down among gas-well drillers.
For other great articles about exploration, drilling, completions and production, subscribe to The American Oil & Gas Reporter and bookmark www.aogr.com.


