Tubulars Technology
OCTG Consumption Growth Impacted By Resource Play Technology
By Rick W. Preckel and Paul E. Vivian
ST. LOUIS–The active rig count has been the standard barometer of oil and gas industry health for many years, facilitated by the ready availability of weekly rig count data. Directionally, rig counts still indicate the trajectory of industry activity at any given time, but the relationship between rig count and the consumption of hardware and services is not uniform by region, much less over time.
The consumption of oil country tubular goods per drilling rig has improved consistently during the past four decades, but never has it been truer that a rig today is much different than a rig in the past–even the relatively recent past–in terms of OCTG consumption.
The application of technology, beginning with the favorable economics of horizontal drilling and accelerated exponentially with the broad application of pad drilling in recent years, has had a dramatic effect not only on the quantity and speed of pipe consumption, but also on the sizes, walls, grades and connections of the pipe selected.
There are three primary factors that determine OCTG consumption in any given period. First and foremost is the number of wells drilled. This is a function of an operator’s ability to drill a well and get an acceptable rate of return based on the commodity price, production costs, the availability of dollars if the operator is spending beyond its cash flow, and rig contracts (which may result in drilled but uncompleted wells).
Industry observers tend to think of drilling activity as a collective, making statements such as, “We are drilling more wells than are required by demand.” That may, in fact, be true in a given period, but is obviously not key to the decision-making process, at least not in cases that exclude national oil companies. Each company makes this decision independently on a well-by-well basis and may be driven not only by the expected rate of return, but also by reserve replacement, production goals, prices and volumes committed due to hedging, and a variety of other factors. This, by the way, is why we are condemned to boom-and-bust cycles.
The second factor in determining OCTG consumption is where these wells are drilled. Each region and field has its own set of string designs, which change over time and determine how much pipe goes into each well. Per-well pipe consumption ranges from more than 1,000 tons in some offshore Gulf of Mexico wells to 500-700 tons in horizontal wells in onshore U.S. resource plays, to a little more than 100 tons in vertical wells in conventional fields.
The third factor is the speed at which each well is drilled. This last item, combined with the number of wells drilled and weighted by region, determines how many rigs it takes to make this happen. Changes in OCTG consumption per rig over time are partially a reflection of regionality, but they correlate much more with improvements in oil field technology.
How Many Wells?
For simplification, and considering readily available data, let us simultaneously address well counts and the speed with which wells can be drilled. The first component is the volume of oil, natural gas and natural gas liquids the market will bear while maintaining prices sufficient to support the required rates of return. The second component is well productivity, which helps determine how many wells will be required to reach that output.
As noted, the number of wells drilled depends on the opportunity to meet ROR targets, drilling opportunities, finances and/or additional production/reserve needs. Meeting ROR targets is a function of prices, which operators do not control, and costs, over which they exert some influence.
In theory, the price for oil or natural gas should be based on the lowest cost at which it can be produced based on capacity plus transportation. In other words, if one assumes that the Middle East has the lowest-cost oil to produce (which, in and of itself, could be the topic of an additional article), countries in that region would produce to full capacity, followed by the next lowest-cost region, and so forth. Two factors prevent that.
One is the oligopolistic behavior of the Organization of Petroleum Exporting Countries, which seeks to control the market to boost prices/revenues. Second is the fact that Middle East costs are not as low as they appear, because these countries’ oil revenues must not only cover production costs, but must also fund their governments. Saudi Arabia, making the decision to drive prices down in late 2014, also undertook an effort to reduce spending on social programs and shift the economy away from its reliance on oil.
In any event, OPEC used to wield significant sway in the oil market, since the production costs for the next significant source of hydrocarbons were higher. Prior to 2014, we estimate a number somewhere between $80 and $100 a barrel as the price at which most OPEC countries settled in to meet their spending demands at their allotted volumes. U.S. oil resource plays changed all that, of course, as everyone engaged in the global oil and gas business certainly understands.
But the point of this largely remedial discussion is an attempt to explain why it is virtually impossible to accurately estimate how much U.S. production will be required based on some demand model alone in order to determine the number of wells that must be drilled during the next 12 months (and, therefore, the strength of OCTG demand). U.S. drilling activity is based on operators’ ability to achieve target ROR, which in turn, is determined by the price/cost relationship of oil and natural gas. Price, of course, is controlled by supply/demand metrics.
Quantum Shift
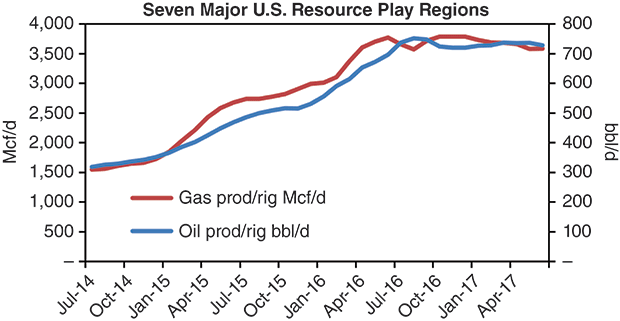
In terms of determining the number of wells drilled in one period relative to another, it is necessary to turn to readily available data from the U.S. Energy Information Administration’s Drilling Productivity Report to help define the relationship between a well drilled in 2017 and a well drilled in 2014. In this report, well productivity is combined with drilling speed to establish a measure of the first full month of production per rig. Figure 1 plots the first full month of production per rig for all seven major shale regions, which collectively account for two-thirds of total U.S. rig activity.
As the chart shows, each rig operating today results in nearly twice as much crude oil and natural gas production as a rig did in mid-2014 on a first full-month basis. One interesting aside worth noting is that based on these data, first-month production per rig for both oil and gas was flat during the course of the past year, although company reports suggest otherwise.
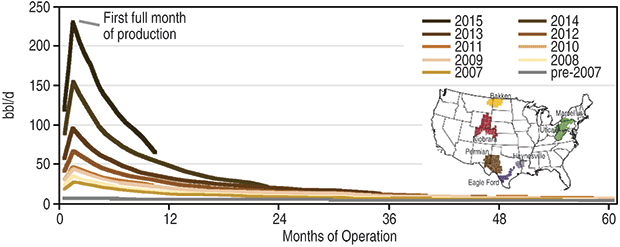
In any event, Figure 2 is a reproduction of an EIA chart that shows the initial production and the production decline of wells during the past several years. While this chart is for the Permian Basin, the other six major tight oil and shale gas regions have similar profiles. The technologies influencing well productivity revolve around lateral length, well spacing and the optimization of completion practices (including the number of stages, proppant volumes and hydraulic fracturing treating pressures, to name only a few completion design variables).
With regard to drilling speed, a variety of data sources can be used to identify trends and attempt to quantify changes, including several noteworthy references in recent earnings calls. Cabot Oil & Gas, for example, included a chart of Marcellus Shale drilling speeds from spud to total depth that showed a decline from 18 days a well in 2014 to 12 days/well in 2017. An EOG Resources presentation noted that its Permian Basin drilling times decreased 45 percent between 2014 and the end of 2016. Drilling contractor Helmrich & Payne reported that it drilled Eclipse Resources’ Outlaw C 11H “super lateral” in the Utica Shale in only 17 days during the second quarter–a well with a record-setting 19,500-foot lateral section and a total drilling depth of 27,750 feet.
Meanwhile, Comstock Energy reports it is drilling Haynesville horizontals twice as fast as six years ago. In its fourth-quarter 2016 earnings call, one of Range Resources’ senior executives said the company had realized a 40 percent year-over-year increase in lateral footage drilled each day. Another leading Marcellus operator, Antero Resources, has revealed that it has slashed average drilling times for 9,000-foot Marcellus horizontals from 30 days a year ago to only 12-14 days.
The anecdotal evidence goes on and on. Overall, based on the data we have collected, a rig today can drill 30-40 percent more wells in a given time frame in a given region than it could in 2014. In the context of weekly rig counts, this essentially means that the 377 rigs drilling in the Permian Basin in early August were as productive as 509 of the 555 rigs active in the basin during the first week of August 2014. The technologies that have improved drilling speed include rig design and horsepower, automation, high-pressure mud pumps, improved data, better targeting, and a host of other improvements.
Another contribution is the lower risk associated with the fact that drilling in unconventional plays is more developmental than exploratory by nature, which has boosted the producing well-to-dry hole ratio.
When the improvements in production per well (higher productivity) combine with increasing drilling speeds (higher efficiency), it takes roughly half as many rigs today as it did in mid-2014 to generate the same first-month production total. This quantum shift in drilling efficiency and productivity, driven by the economic necessity of a price slump, is completely redefining the significance of rig counts and other conventional industry “scorecards.”
More Pipe Per Rig
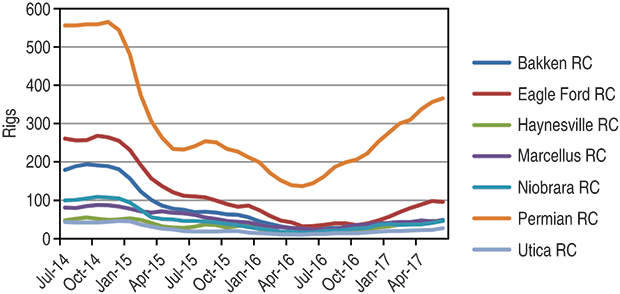
The other factor determining how much OCTG a rig consumes is the regionality of drilling, and the changes in the string designs for each region over time. As Figure 3 illustrates, in the commodity pricing environment that has characterized the market since late 2014, the Permian Basin and Eagle Ford plays together account for more than half the total rig count in the seven major shale basins. OCTG consumption per well in these two regions ranges from more than 700 tons for deep, long-lateral horizontals to slightly more than 100 tons for traditional vertical wells. In these regions, as in others, OCTG consumption per well has increased an average of 25-35 percent since 2014.
So exactly how much more pipe is each rig consuming? We expect the 2017 rig count to average 875 rigs as compared with 1,862 in 2014, and expect consumption of OCTG in 2017 to be 5.2 million tons compared with 7.2 million tons in 2014. In other words, because of faster drilling speeds and more pipe per well, a rig today consumes almost 55 percent more pipe than a rig did only three years ago. And a rig today will yield nearly double the oil and gas production compared with a 2014 rig.
Now that the relative relationship between rig count and OCTG consumption has been established, it is appropriate to consider the forecast for OCTG for the fourth quarter of 2017 and into 2018. As always, drilling activity ultimately will be based on oil and gas prices. There are two common commodity price themes: day-to-day and longer term. Weekly U.S. inventory movements, rig counts, OPEC meetings, political events, financial reports and any number of other factors can send short-term prices up or down at a moment’s notice.
However, many believe that a lack of global investment during the past three years will send prices higher in 2019 and beyond. We tend to be in that camp. In fact, we believe the likelihood of higher prices in the 2019 timeframe is greater as a result of today’s somewhat bearish pricing trend because it stymies capital investment pretty much everywhere except in U.S. shale plays. That is about to change, however, at least to some degree.
Based on information from our industry contacts, a sizable percentage of rig contracts are running out this quarter, and prices for rigs, frac fleets and other services are rising. Oil and gas prices are better and efficiencies largely have kept the effect of cost inflation at bay, but at some point, it will start to take a toll. Some rigs probably begin to peel off in late summer, and that trend should accelerate in the fourth quarter and through the first part of 2018. Even so, the overall effect will not be catastrophic. Although the concept of a “soft landing” is somewhat foreign to the oil and gas industry, that is what we expect–something like the market in 2012-13, when drilling and completion activity switched away from natural gas to NGLs and crude oil.
One caveat to the concept of a soft landing is that something always seems to exacerbate the cycles. For example, in 2014 overproduction was weakening oil prices, but producers did not really react until OPEC began its campaign to purposefully overproduce and drive the price down. That magnified the effect of existing excess supply and changed the mindset of the entire global market. There are many more examples, and unfortunately, these things are rarely predictable.
That said, however, we expect a modest decline of, say, 10-15 percent in drilling activity during the next few months, followed by a growth cycle starting in the second half of 2018 into early 2019 based on higher commodity prices, which we expect to last for a few years.

RICK W. PRECKEL is a principal at Preston Publishing Company in St. Louis, a steel pipe and tubulars market research and consulting firm that publishes the monthly “Preston Pipe & Tube Report,” which analyzes U.S. and Canadian supply. With 31 years of experience in the tubulars industry, Preckel’s background includes all key functions of running a business, including accounting, marketing, supply chain management, information technology, strategy and expansion. His former roles include chief executive officer, vice president of investor relations and business development, vice president of shared services, marketing manager, and controller. Preckel holds a B.S. in business with an emphasis in accounting from the University of Missouri.

PAUL E. VIVIAN is a principal at Preston Publishing Company. He has 36 years of experience in the pipe and tubing industry, working in both distribution and manufacturing. While in the distribution business, Vivian was involved in purchasing, inventory management, supply procurement, sales and site selection. While in manufacturing, his focus was on business plan development, forecasting, international trade and sales. Vivian holds a Ph.D. in economics with an emphasis on statistics, and is a graduate of the University of Wisconsin’s graduate school of banking.
For other great articles about exploration, drilling, completions and production, subscribe to The American Oil & Gas Reporter and bookmark www.aogr.com.


