Outlook Mirrors Last Winter, But With Less Gas In Storage By End Of Heating Season
By Stephen L. Thumb
ARLINGTON, VA.–The long-term trends are decidedly bullish for North American natural gas demand, with market forecasts indicating expanding future usage in sectors such as power generation and transportation, as well as arguably the single biggest potential game changer: U.S. liquefied natural gas exports. But what about the short term? What do the supply and demand variables suggest for the winter heating season?
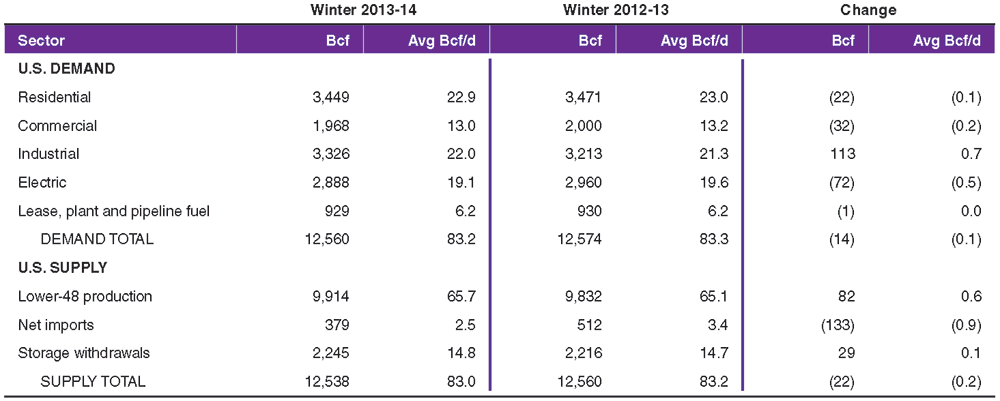
To put it simply, natural gas demand for winter 2013-14 should be about the same as last winter. In fact, for all practical purposes, the outlook for both supply and demand looks very similar to last winter. However, this overall assessment is the net result of several offsetting variances.
With respect to natural gas demand, for example, winter weather that is forecasted to be slightly milder than the historical norm will lead to modest declines in the residential and commercial sectors, and anticipated higher natural gas prices this winter are expected to reduce coal-to-gas fuel switching in the power sector. However, those declines will be offset almost entirely by increased demand in the industrial sector thanks to a series of ongoing capacity expansion projects among industrial users.
Looking at the supply side, incremental increases in domestic natural gas production are more than offset by reductions in net imports, with increased storage withdrawals offsetting some of the difference.
There were 3.81 trillion cubic feet of gas in storage at the unofficial start of the heating season on Nov. 1, according to the U.S. Energy Information Administration. That compares to 3.93 Tcf in storage at the same time in 2012. Withdrawal patterns are anticipated to be 1.3 percent (200 million cubic feet a day) higher than last winter, which would further erode the storage overhang that has persisted since the historically mild 2011-12 winter, and would leave end-of-winter storage at 1.55 Tcf, or 132 Bcf below volumes at the end of last winter (and on par with average beginning-of-spring storage levels for the five years prior to 2012).
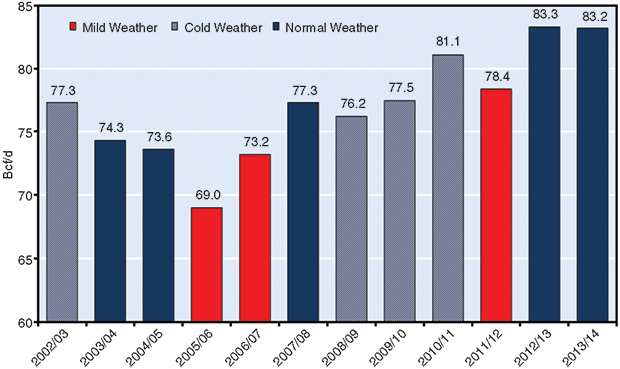
Table 1 provides both cumulative demand and supply projections for the winter season. By far, the greatest area of uncertainty is the forecast for winter weather. According to the National Oceanic and Atmospheric Administration’s heating degree day forecast, December through February will be 2.8 percent warmer than the 30-year norm, but still 1.3 percent cooler than last winter. Figure 1 compares the winter outlook with actual results over the past decade.
Determining the net impact of weather variances on gas demand can be very challenging. For example, while more severe weather would increase demand in the residential and commercial sectors and draw more gas from storage, it likely would raise prices, which in turn, could result in increased reductions in fuel switching in the power sector. Of course, the opposite set of events would occur if the winter was milder than predicted.
Changes in winter weather can have a particularly significant impact on demand in the residential and commercial sectors. Consider the difference in demand between the winters of 2010-11 and 2011-12 (i.e., 942 Bcf, or 17 percent) as a classic example. This winter, December and January are forecast to be colder than last year, while February and March are forecast to be milder (March 2013 was the coldest in 16 years). The net effect of these offsetting parts of the winter season is that total residential and commercial demand is expected to be about the same as last winter, with a slight decline of 1 percent (300 MMcf/d).
Fastest Growing Sector
Industrial is the fastest growing sector in the natural gas industry. Two factors are driving this growth: a series of capacity expansions by high-volume consuming industries in the sector, and the impact of the ongoing slow recovery in U.S. economic growth, which is benefitting the entire sector.
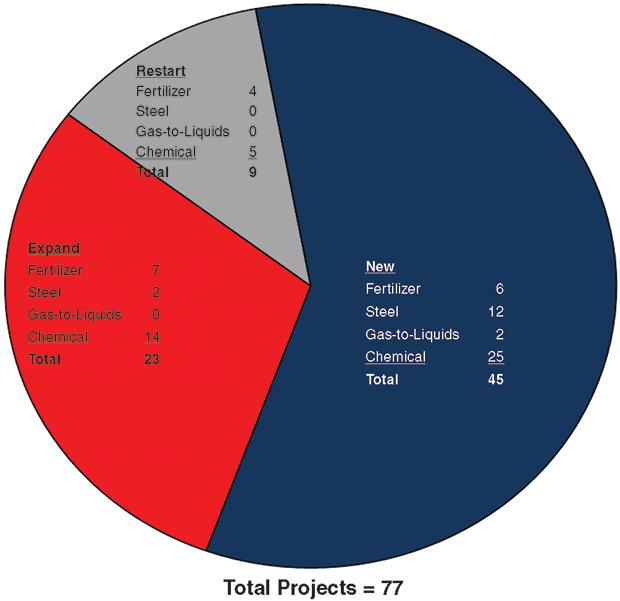
Thanks to shale plays, the supply surety, relativly low cost and environmental benefits of natural gas are creating competitive advantages for industrial users, particularly those in four key segments leading demand growth in this sector: fertilizer, chemical, steel and gas-to-liquids. These industries are making significant capital investments to expand capacity. As illustrated in Figure 2, there have been 77 capacity expansion projects announced to date, which include restarting previously mothballed units, facility expansions, and the construction of “greenfield” plants. All of these projects are major consuming facilities that use natural gas a feedstock or burn significant quantities of gas as an energy source.
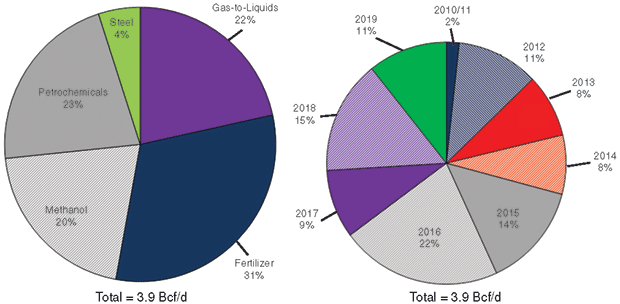
With respect to the longer-term impact of these 77 projects on natural gas consumption in the industrial sector, Figure 3 summarizes the anticipated increase in gas consumption for each major industry, with a total of 3.9 Bcf/d for all projects through 2020 (collectively increasing industrial sector demand by more than 20 percent). To provide additional insights, the chemical industry has been subdivided into the petrochemical and methanol segments.
With respect to the near-term impact of these capacity expansions, five previously shuttered facilities were restarted in 2012 and 2013, 11 plants were completing expansion projects, and seven new plants were constructed. Of these 23 projects, seven are in the fertilizer industry, 10 are in the petrochemical and methanol segments, and five are in the steel industry. The net effect of these capacity expansion projects has increased industrial gas demand approximately 400 MMcf/d in 2013. Another 14 projects are expected to come on line in 2014, which should increase sector gas demand by another 500 MMcf/d.
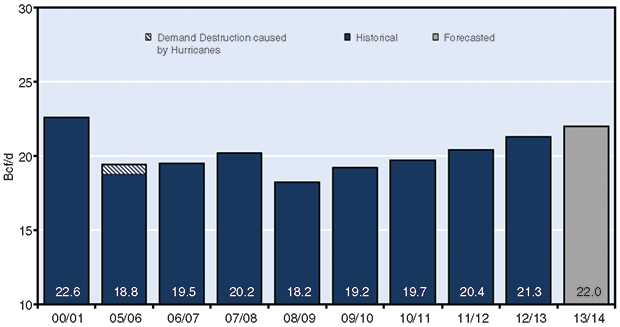
The integrated outlook for industrial sector demand calls for an increase of 700 MMcf/d (3.5 percent) over last winter’s level. As an added point of perspective, Figure 4 compares 2013 industrial demand with consumption levels for selected years since 2000 on an annual basis. During 2000-10, the dominant trend for industrial sector demand was decline, as the sector initially experienced significant price elasticity from high prices and then the impact of the recession. Starting in 2010, however, this downward trend reversed itself. In fact, forecast industrial demand for winter 2013-14 (22.0 Bcf/d) exceeds the peak levels in every winter since 2000-01 (22.6 Bcf/d).
Fuel Switching
Because of the mild summer weather, there was no significant growth in U.S. electricity sales in 2013. However, excluding July and August, electricity sales this year were 0.5 percent above the same period in 2012, with most of this increase related to the modest improvement in the national economy. This is expected to carry over into the winter, accounting for some load growth.
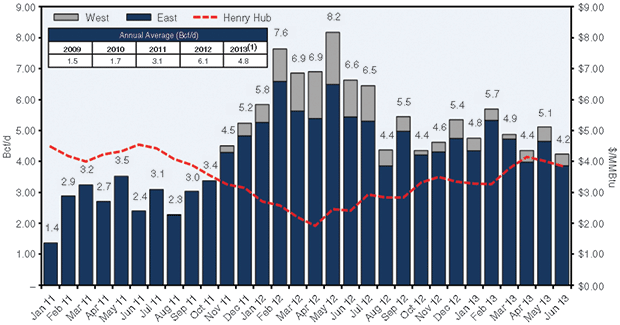
The most significant factor impacting power sector gas demand is coal-to-gas fuel switching. Based on the outlook for gas prices, coal-to-gas fuel switching is expected to be about 900 MMcf/d less than last winter, largely because of higher anticipated gas prices this winter. As a result, overall power sector demand is expected to decline by 2.4 percent to 4.2 Bcf/d, compared with 5.1 Bcf/d last winter, with load growth and some coal retirements offsetting the decline in fuel switching. This would be consistent with the basic trend in the industry, which saw monthly fuel switching levels peak in May 2012 at 8.2 Bcf/d when Henry Hub prices were low, and then decline as prices strengthened, although the pattern has been erratic (Figure 5).
While it is unlikely that new gas-fired capacity additions will have a significant impact on electric sector demand this winter, trends in new gas-fired additions are meaningful for assessing the intermediate-term demand outlook in the sector. Table 2 summarizes gas-fired capacity additions since 2009, along with projected additions in 2013 and 2014 as well as capacity additions for its two key competitors: coal and wind.
As illustrated, gas-fired, combined-cycle capacity additions are expected to total more than 30,800 units from 2012 to 2014, up substantially from about 19,000 in the three prior years. New coal plants will be limited to a few units that are either under construction or have been fully permitted. More significant is the level of retirements of coal-fired facilities as a result of both environmental regulations and the inability to compete economically with gas-fired generation.
TABLE 2
New U.S. Generation Capacity
Note: Wind capacities for 2013 and 2014 are estimates, with total capacity of proposed projects significantly exceeding these estimates
With respect to wind generation, uncertainty over federal subsidies resulted in a rush to complete wind projects in the fourth quarter of 2012, and then a sharp reduction in the financing of wind projects in 2013. While the federal wind subsidy was renewed for another year in late 2012, new projects fell by 74 percent in 2013.
Supply-Side Scenario
Mirroring the outlook for demand, total natural gas supply for winter 2013-14 should be on par with last winter, averaging 0.2 percent (200 MMcf/d) less, assuming a similar storage withdrawal pattern to last year’s slightly warmer-than-normal winter. An expected modest gain in U.S. production will be more than offset by a decline in net imports from Canada and an increase in net exports to Mexico.
Looking at data over the past five winters, the growth in U.S. production (i.e., approximately 10 Bcf/d since the winter of 2009-10) is very apparent, as is a corresponding decline in net imports of about 5 Bcf/d over that period. It appears that the rate of growth for U.S. production is starting to level. Production has been flat since the third quarter of 2012, but the market generally remains in the “excess” supply situation that has been a part of the industry since 2009.
However, despite the decline in gas rig counts over the past few years, lower-48 production levels are unlikely to decline in the intermediate term because of the large number of infrastructure projects that are coming online to bring take-away capacity to “stranded” supplies from previously drilled wells. With ongoing expansions of pipelines, processing plants and other infrastructure, U.S. production this winter should be very close to last winter, with a projected increase of 0.8 percent (600 MMcf/d).
While gas production from shales has more than doubled over the past five winters, this upward trend probably will be arrested this winter because of reduced drilling activity in these plays. Per-well productivities in horizontal shale plays are much higher than in conventional plays, resulting in the need for fewer wells, but it should be pointed out that monthly gas well completions have been declining since late 2010, and appeared to reach a low point in mid-2013.
It is also important to note that gas production associated with oil development has increased some 500 MMcf/d (3.2 percent annually) since winter 2010-11, and further increases are expected from tight oil plays, especially as infrastructure is built to market associated gas that currently is being flared because of a lack of gas facilities.
Industrial Resurgence
Looking at the intermediate term of three to five years, U.S. shale gas development has ushered in a new era of demand growth potential. As noted, a key outcome of the new realities in natural gas supply is resurgence in the industrial sector. Of all the types of industrial projects, none offers larger potential point-load demand than gas-to-liquids.
There are two major outstanding projects: one operated by Sasol and the other by Shell. High capital costs create enormous challenges for both projects, but the Sasol project is slated for completion in two trains in 2018 and 2020, respectively, and Shell announced in late September that it had selected a site in Ascension Parish, La., for its planned $12.5 billion GTL facility.
Meantime, the U.S. petrochemical market is seeing a resurgence once thought impossible, thanks to the United States emerging as the world’s largest producer of olefins and aromatics-based petrochemicals. In addition to ethane consumption, an 800 MMcf/d increase in incremental gas demand is forecast to meet increased energy requirements at new and expanded petrochem facilities. This growth will manifest itself in the form of 30 new petrochemical projects in the Gulf Coast and Northeast regions. Twenty-four of the projects are dedicated to creating ethylene (primarily sourced from ethane), while the other six produce ethylene/propylene derivatives.
Once a niche industry, methanol is experiencing rapid growth as well. At the beginning of 2011, annual U.S. methanol capacity was 800,000 tons. Since then, a number of previously idled facilities have been restarted, such as LyondellBasell’s plant in Channelview, Tx., which are expected to create an additional 6.0 million tons/year of new methanol capacity by 2020. These new plants, along with planned restarts, are expected to add 700 MMcf/d in demand.
Given its economic and environmental advantages over coking coal, natural gas also is likely to grow in the steel industry, albeit at a relatively slower rate. The displacement of coking coal will occur through both natural gas injection in blast furnaces, as well as using natural gas to fuel direct reduction iron (DRI) operations, which is a less energy intensive iron-making process. The sponge iron from DRI operations can be used as feedstock for either an electric arc furnace or a blast furnace.
Nucor has announced plans to build a new gas-fired DRI plant in St. James Parish, La., while Vallourec and Mannesmann Holding Inc. are building a new gas-fired steel plant in Youngstown, Oh. U.S. Steel is evaluating using natural gas at some of its operations, and projects that natural gas would reduce raw steel costs by $6-$7 a ton. Furthermore, U.S. Steel has indicated that the cost would be minimal to increase the ability to inject greater quantities of natural gas into blast furnaces at its plants.
As the world’s largest importer of fertilizer, reduced natural gas prices have created an enormous opportunity for lower-cost domestic producers to push out production from other countries. The fertilizer capacity projects making up the new gas consumption volumes can be divided into demand-located versus supply-located plants, with the former in the Midwest and the latter along the Gulf Coast. The largest projects consist of a greenfield fertilizer plant in Weaver, Ia., operated by Orascom, as well as large expansions by CF Industries in Donaldsonville, La., and Deerfield, Il.
LNG Potential
One of the biggest potential growth areas for natural gas over the longer term is also the one with the biggest question marks: LNG exports. There are 23 liquefaction projects proposed in the lower-48 with a combined capacity of 28.1 Bcf/d. Of these, four projects with 6.6 Bcf/d of capacity have received permits to export LNG to countries that are not participants in free trade agreements. Including one proposed liquefaction project in Alaska (2.2 Bcf/d capacity) and 10 projects in Canada (combined capacity of 15.8 Bcf/d), total proposed North American liquefaction capacity is 46.1 Bcf/d, which is 46 percent greater than current global LNG demand.
Among the significant characteristics of lower-48 LNG export projects is that 50 percent of the proposed capacity is conversions of regasification terminals. These brownfield projects should have lower capital expenditures than competing greenfield projects.
Almost 90 percent of the capacity is located in the Gulf Coast region, and plan to primarily serve the Asian market by shipping LNG through the Panama Canal. The potentially most important attribute of the lower-48 projects is their success to date in securing long-term off-take agreements. Current off-take agreements total 13.2 Bcf/d, of which 44 percent (5.8 Bcf/d) is for the four projects that already have received non-FTA permits.
While the spot market for LNG is tight right now, longer term potential LNG supply exceeds global demand, particularly in the Asian market. With respect to future global LNG supply, there is not only intense competition between proposed North American liquefaction projects, but even more intensified competition between North American projects and a series of other liquefaction projects being built elsewhere in the world.
Editor’s Note: The preceding article is based on a comprehensive winter outlook report initially prepared for the Natural Gas Supply Association. That analysis is available for review on NGSA’s website at http://www.ngsa.org/download/EVA%20FINAL%20NGSA%20Winter%202013%20Outlook.pdf.

STEPHEN L. THUMB is a partner at Energy Ventures Analysis Inc. He is responsible for the firm’s oil and natural gas practice, and has been involved in a wide variety of projects, primarily for industrial and electric utility clients. Examples include preparing strategic plans, assisting in asset acquisitions and divestitures, coordinating market studies, producing price forecasts, and serving as an expert witness. In addition, Thumb has authored or co-authored more than 50 Gas Technology Institute and Electric Power Research Institute reports on oil and gas topics. Prior to joining EVA, Thumb had 15 years of experience in the oil and gas industry, including five years as vice president of planning and analysis at Meridian Oil/Burlington Resources. He also served at Ashland Oil and Getty Oil. Thumb was an officer in the U.S. Navy. He holds a B.S. in chemical engineering from Northwestern University and an M.B.A. in finance from American University.
For other great articles about exploration, drilling, completions and production, subscribe to The American Oil & Gas Reporter and bookmark www.aogr.com.


