Oil & Gas Computing
Predictive Analytics Bring New Capabilities To Shale Development
By Duane Dopkin, Indy Chakrabarti and Zvi Koren
HOUSTON–Predictive analytics are used in many fields as a forecasting tool to speed decision-making and ramp performance, making use of vast amounts of historical and available data. Physical models, machine learning methods, artificial intelligence algorithms and more traditional statistical approaches are used to make more accurate predictions.
Predictive analytics have been successfully applied to unconventional resource plays to search for meaningful associations between production data and petrotechnical data where relevant associations can be used to predict sweet spots and determine optimum well spacings or lateral lengths. These methods apply proven statistical methods to search for these associations.
Several innovative predictive methods are applicable for use by geoscientists, as well as reservoir, drilling and production engineers. These techniques include physics-based forecasting, “deep learning” and other novel machine learning methods for enriching the models. The resulting models and outcomes can be used for prospecting, well planning, geosteering and anticipatory production optimization. They are potential game changers for shale players.
The role of seismic data and geophysics in shale plays has evolved tremendously over the past five years. Today, robust anisotropic depth imaging methods provide a pathway to ensure that lateral wells are positioned accurately and that wells are steered with precision. Multiazimuth seismic inversion procedures now are routinely deployed to locate areas of natural fracture intensity and to provide measures of fracture and stress orientation. The reliability of these methods is strengthened when the data are properly imaged in situ and in depth, such that the azimuthal data are properly recovered by the inversion.
Oil and gas operators also have learned to appreciate the role of structure controls (e.g., faults) and their controlling influence on the compartmentalization of shale formations and productivity of field operations. While major faults easily can be identified and interpreted with traditional seismic reflection processing and imaging methods, new methods are required to uncover smaller faults from surface-recorded data. The seismic signatures from these smaller faults are generally of much lower energy than the reflected energy returned from large faults and formation boundaries. These small faults are local discontinuities that act as point sources for the generation of diffraction energy.
Two-Fold Challenge
Consequently, seismic imaging methods that can preserve and isolate diffraction energy provide an approach for imaging small-scale subsurface geologic objects and discontinuities such as faults and even fracture systems. While there are numerous methods for carrying out diffraction imaging, the challenge for all of them is two-fold:
- To properly map (image) the low energy diffraction data recorded at the surface of the earth into in situ prestack data organizations in depth without further attenuating or removing the diffraction energy; and
- To search for the diffraction energy and separate it from the higher (specular) energy reflection events in an automated and efficient manner.
The first challenge is accurately solved with a full-azimuth depth imaging method using subsurface angle domain decomposition. While details of this method are beyond the scope of this article, the method maps the fully recorded surface seismic wavefield into continuous full-azimuth directivity (dip/azimuth) components in situ for all subsurface image points. In doing so, the fully recorded wavefield (specular and diffraction energy) is preserved in the depth imaging process. More importantly, the data are organized to facilitate analysis in different dominant subsurface directions.
Traditional methods for searching these directivity data organizations for diffraction energy (addressing the second challenge) include dip or energy filtering, where diffraction and specular energies can have different signatures for both data types. While these methods are generally intuitive to understand, their ability to fully decompose the different image characteristics is somehow limited by their coupling relations. Moreover, these methods can require considerable human effort or test runs to optimize the output diffraction image.
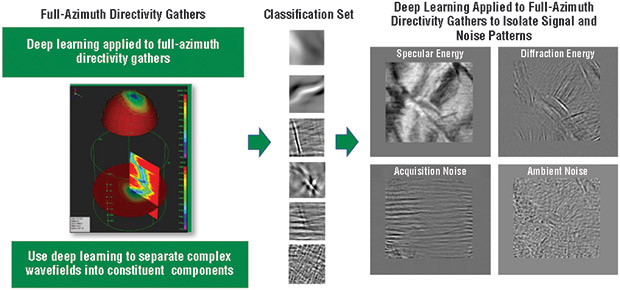
Machine learning provides an alternative approach to the second challenge by enabling automatic classification and separation of wavefield patterns associated with different subsurface shale features (faults, fractures and continuous events) and even different styles of noise (e.g., ambient noise, acquisition footprint, etc.).
FIGURE 1
Analyzing Full-Azimuth Directivity Gathers using Deep Learning Workflow (Eagle Ford Dataset)
The first stage of the process is the application of principle component analysis (PCA) to the directivity gathers (along relatively small 3-D spatial windows) to isolate the principle directivities (wavefield patterns) associated with subsurface features and various types of noise at each location. The goal is to extract a few principle directions that describe the variability of the data types in the subsurface. This has the added advantage of providing a better geologic separation of seismic events while reducing the huge dimensionality of the full dataset.
The second stage involves training a convolutional neural network (deep learning) with the many geometric patterns (classifications) from the PCA outputs: back-projection of the principle components to the image domain. Figure 1 shows the deep learning concept applied to full-azimuth directivity gathers of an Eagle Ford Shale dataset. Convolutional neural networks are a popular platform for classifying (labeling) and predicting differentiating shapes.
Deep Learning Neural Network
FIGURE 2
Fault Imaging using Deep Learning versus
Deterministic Classification Methods
(Eagle Ford dataset)
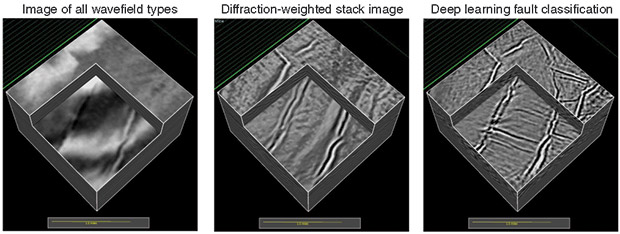
Convolutional neural networks consist of multiple layers, where each layer contains a set of learnable filters with a small visual field of the input image. As a result, the network learns filters that activate when it detects a specific type of feature. This deep learning convolutional neural network can differentiate between different wavefield signatures associated with reflectors, faults, point diffractors, ambient noise and even migration noise. For example, Figure 2 compares fault imaging for the same Eagle Ford Shale dataset using a deterministic method versus a deep learning classification method.
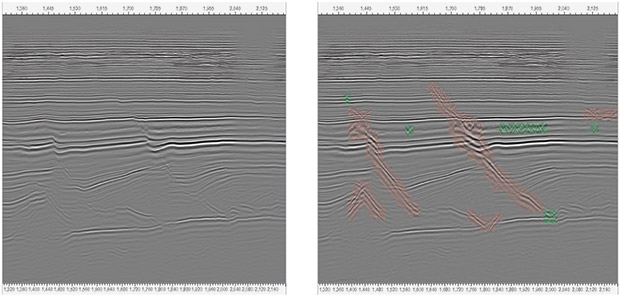
This classification procedure allows the geophysicist to create targeted images that emphasize subtle low-energy events missed by conventional imaging methods or even remove energies associated with undesirable ambient, acquisition or processing noise. The left-hand image in Figure 3 shows principal components classified as reflectors in an Eagle Ford Shale dataset, while the right-hand image shows principal components classified as faults (red) and point diffractors (green).
FIGURE 3
Principal Components Classified as Reflectors (Left)
And as Faults/Point Diffractors (Right) in Eagle Ford Dataset
The deep learning procedure can be adapted to the characteristics of a targeted shale asset. Recovering small or low-energy faults in the Eagle Ford Shale or removing noise patterns in Permian Basin shales are all feasible operations with these convolution neural network operators. More importantly, they can perform this operation in an efficient and automated manner to accelerate the interpretation and modeling workflow. In conjunction with the proper construction of the input data (full-azimuth in situ directivity gathers), the application of deep learning methods can greatly increase the value of seismic data in resource plays. As the technology evolves, it is envisioned that the method can be optimized for each shale asset and each seismic acquisition, capturing their respective structural complexities and noise patterns.
Resolving Shale Lithofacies
Shale plays are highly variable in the spatial distribution of lithofacies defined by their respective mineralogy, organic content and brittleness. The shale formation is a component of a broader interconnected series of overlying and underlying formations (often carbonates) that define the full resource play and petroleum system. Facies changes can occur over relatively short distances. An accurate determinations of facies distributions will invariably lead to a more realistic measure of reservoir behavior.
Predicting and modeling lithofacies heterogeneities allows geoscientists and drilling engineers to better understand the depositional processes that produced these heterogeneities and to optimize well placement and well plans for long laterals, staying in the sweet zones defined by the most productive lithofacies.
Modeling these lithofacies heterogeneities, however, is problematic as useable well data may be sparsely sampled and seismic data may lack the resolution to resolve them. Seismic inversion methods make use of both well data and seismic data to predict elastic properties, but suffer from the problem of “non-uniqueness” and overlap in cluster (classification) space. Unsupervised seismic classification procedures also are limited by the fact that lithology is not linearly correlated with seismic data and do not carry a measure of uncertainty with their classifications.
To resolve these ambiguities, machine learning methods are being introduced that elevate seismic data from an exploration tool to a field development tool. The method also elevates the classification scheme from an unsupervised to a supervised approach, while carrying probabilities for each facies and the most probable facies.
The strength of the method is the ability of the system to integrate data of different types (core, wireline and seismic data) and resolutions (Figure 4). The workflow begins by constructing rock type models from pairs of well log data where well log measurements that best describe the facies are selected. In this process, another machine learning method referred to as multi-resolution graphic clustering (MRGC) is used. This method defines clusters of different resolutions and can differentiate between homogeneous sands and finely laminated sands, for example.
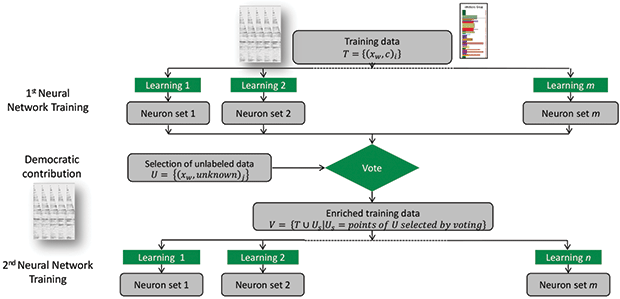
The next step is to generate a probabilistic rock type model for the full area with the guidance of seismic data. Toward this end, an ensemble of naïve neural networks, each with a different learning strategy, are run simultaneously as an associative combination to predict the rock types (Figure 5). Using multiple neural networks prevents biasing of any one of the neural network architectures.
To train the neural networks, both seismic data and lithofacies data interpreted at each well location are introduced. This constitutes the hard training data. The seismic data training set can carry the full dimensionality of prestack data, if desired. In the second phase of the training, soft data (seismic data away from the well bore) are introduced and the neural networks “vote” on their inclusion into the training set. The introduction of soft data avoids overlearning with a limited dataset.
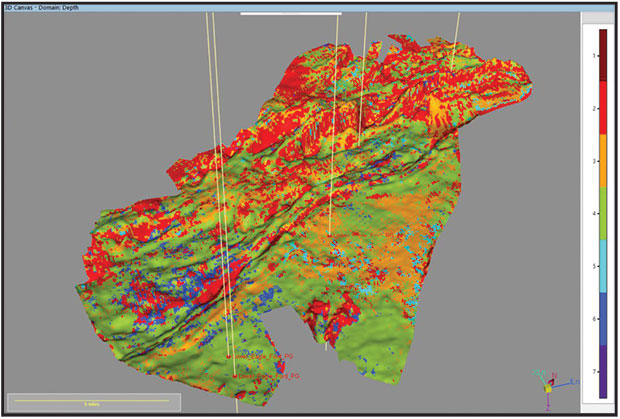
The final step is to propagate the neural network properties into full probabilistic facies models, where the most probable facies or the probability of individual facies can be analyzed. Figure 6 shows the most probable facies of the Lower Eagle Ford Shale zone.
The analysis of the probability distribution gives good insights into prospect uncertainty and seismic data reliability for prediction. Shale geoscientists and drilling engineers now have a lithofacies model to correlate with other field data and to optimize well plans. This technology should be applied to all shale resource plays where lithofacies heterogeneities directly impact hydraulic fracturing success.
Optimizing Shale Production
Predictive analytics technology is just as critical to apply during the production life-cycle as it is during exploration and development. Not only must operators ensure they are drilling in the right location, but they must avoid production deferral and maximize the life of the field by producing optimally from the reservoir.
Leadership in today’s unconventional oil and gas environment requires skilled management of ever-increasing volumes of data. The data are analyzed by expert asset teams that alert the business to production challenges and offer solutions using state-of-the-art methods. Production issues still are detected after the fact, however, and the ability to provide solutions is often hampered by missing information. Advanced workflows requiring rich datasets and incorporating reservoir physics-based predictive analytics have been considered too complex, time-consuming and impractical.
Optimized production operations require knowledge of critical parameters such as flow rate, pressure, temperature and composition from the reservoir to the surface. Many of these parameters, however, go unmeasured because of both technical and cost constraints. The less information available, the more we must rely on simplified approaches to analysis and design, risking overdesign, rework and deferred production.
Numerical reservoir simulation is an approach that many operators are using to predict well performance. While this is a mature technology that uses production data to enrich datasets and predict future performance, the method is time consuming and resource intensive. Proxy and statistical models alleviate some of these issues, but reintroduce the risk involved in ignoring subsurface physics.
These problems can be eliminated with a proprietary advanced mathematics engine. The newly introduced solution is a fast, reservoir physics-based predictive analytic solution that helps solve production problems in unconventional plays before they arise. It integrates field data with production and reservoir engineering fundamentals and cloud-based functionalities to enrich production datasets and forecast future performance from the reservoir to the well to the surface.
Complex fluid movements around multifractured horizontal wells are simulated rigorously. Hydraulic fracture models can be oriented and heterogeneous, and include complex structures (Figure 7). Once the fracture scenario is defined, future flow predictions can be computed in a few minutes without the need for special computational infrastructure. The speed of the calculation (which is as accurate as traditional, slower approaches) allows flow predictions for the first time to be used during real-time production operations to make day-to-day changes. In addition, it enables operators to perform scenario testing during the design phase to decide how they should fracture the well.
As an example, these calculations make it possible to more accurately determine the flow regime inside the well bore and predict the onset of liquid loading, which can be debilitating to production. Additionally, the analysis can help determine the optimal operation point for artificial lift and ensure maximum recovery without inappropriate pressure drawdown in the well.
‘Killer App’ For The Cloud
Another area where predictive technology is increasingly important in shale plays is around the early detection of equipment failure. Failure of critical equipment such as electric submersible pumps used for artificial lift can create significant downtime and production deferment. Of course, it is not expected that operators will switch out equipment based purely on a software prediction. However, these “distant early warning signals” allow customers to throttle back on affected equipment, and have enough warning to order replacement parts so that workover time and well downtime can be reduced dramatically when a failure is experienced.
Many oil and gas equipment vendors now offer predictive software for this purpose. Typically, these solutions will key in on precursor signals of failure, gathering data on power fluctuation, temperature, rotation speed and sometimes proprietary conditions. The machine learning implementations generally utilized in these cases are trained on large amounts of past data, including previous failure conditions. Of course, failure is rare, so the training data often use precursor indicators of failure, such as instances when human users intervened on the equipment.
A remaining blind spot for these systems, however, is that they remain primarily focused on signals from the equipment they monitor. Yet so often, changes in the subsurface are the reason equipment fails. This highlights the urgency of combining the predictive analytics happening in the subsurface with surface operations activity.
Indeed, this is a key focus of the new cloud-based solution that integrates both subsurface flow change information and real-time surveillance data taken from the operating equipment. Broadly speaking, gathering both reservoir and operational data in real time from sensors in the field, and transmitting it into the cloud for predictive analytics and subsequent action, has come to be called the Internet of Things (IoT). The potential for productivity gains with these emerging breakthroughs is significant, and in many ways, is analogous to leaps the industry has taken in the past transitioning to mainframes, then to workstations, and now to the cloud.
Ultimately, it is the ability to bring disparate sources of information together in one place, access to the compute power needed to crunch through all the data, and the ability to disseminate information to users wherever they are located that makes predictive analytics the “killer app” for the cloud. We believe the adoption of this technology can help unconventional operators remain profitable in a commodity price environment that appears to remain challenging into the foreseeable future.
Editor’s Note: The authors acknowledge Seitel for providing the original Eagle Ford seismic data used to generate the images in this article.

DUANE DOPKIN is executive vice president of geosciences at Paradigm. In his 30-year career at Paradigm, he has held numerous leadership positions in research and product management roles. Prior to joining Paradigm, Dopkin worked as a geophysicist at Digicon Geophysical Corporation, and served as manager of special products and vice president of research at CogniSeis Development, a geosciences software company that later was acquired by Paradigm. Dopkin holds a B.S. in geosciences from Pennsylvania State University and an M.S. in geosciences from The University of Houston at Clear Lake.

INDY CHAKRABARTI is senior vice president of product management and strategy at Paradigm. Before joining the company in 2013, he served in product strategy, corporate marketing and product management positions at leading software and oil and gas companies, including vice president of strategic marketing at MicroSeismic Inc. and chief marketing officer at Seismic Micro-Technology. Chakrabarti holds a B.S. in electrical and computer engineering from Rice University, and an M.S. in engineering logistics from Massachusetts Institute of Technology.

ZVI KOREN is chief technology officer at Paradigm. He founded the company’s geophysical program in 1990, and headed the team responsible for developing Paradigm’s GeoDepth® velocity determination and modeling system as well as the EarthStudy 360® full-azimuth angle domain imaging system. Koren has won numerous research awards and fellowships for his work in seismic wave propagation, seismic imaging, geophysical modeling and inversion. He holds a Ph.D. in geophysics, and performed post-doctoral research at the Institut Physique du Globe at Paris University.
For other great articles about exploration, drilling, completions and production, subscribe to The American Oil & Gas Reporter and bookmark www.aogr.com.


