3-D Data Aid Shale-Field Development
By Christopher T. Usher
Operators are recognizing that further optimization of exploitation strategies in unconventional resource plays must address well performance variability related to the heterogeneity of the targeted formations. For at least a decade, microseismic monitoring has been adapted by engineers to assess the interaction of frac treatments and local geology. Now the industry is witnessing a major uptake in applying 3-D seismic to understand subsurface variability in the context of developing shale resources.
DENVER–It is hard to imagine the rapid pace of technological change occurring around the unconventional resources plays in North America and beyond. What began with a long cycle of experimentation involving drilling and hydraulic fracturing techniques in U.S. shale gas plays by a handful of innovative operators has accelerated in each successive shale play.
The engineering learning curve that perhaps used to take half a decade to distill into a successful play-specific drilling and completions recipe, has been compressed to less than two years. With an increasing accumulation of industry experience and a diverse range of new companies taking acreage in each succession of hot plays, operators are moving quickly to an effective plateau with their exploitation strategies. In the current commodity price environment, this optimization also has involved shifting from natural gas to liquids-rich unconventional resources opportunities.
The most recent change–a real seismic shift–is the rapid recognition by operators that further optimization of exploitation strategies must address the variability in well performance related to the heterogeneity of the targeted shale formations. Interestingly, for at least a decade, one emerging seismic technology has been adapted by engineers to assess the interaction of the frac and local geology: microseismic monitoring. But it has been only in the last two years that we have witnessed an explosive uptake in using 3-D seismic to understand subsurface variability in the context of developing shale resources.
3-D Seismic Data
It may seem somewhat ironic that the engineering community in resource plays embraced a relatively immature microseismic technology in advance of 3-D seismic, which has been a leading tool for developing conventional resources for decades. But this should not be surprising, since fluids-rich shale play acreage has been leased rapidly on a solid understanding of the widespread extent of the source rock, while the detailed response of an individual fracture to the surrounding rock matrix was less obvious.
But for operators to compete for capital and use it effectively to develop their reserves over the next several years, acquiring comprehensive seismic coverage is often a next step in understanding the variability in shale architecture and composition that affect well performance.
In the past, onshore seismic data libraries did not have design criteria to provide either image resolution or reliable rock property attributes that were sufficient for drilling and completions engineers.
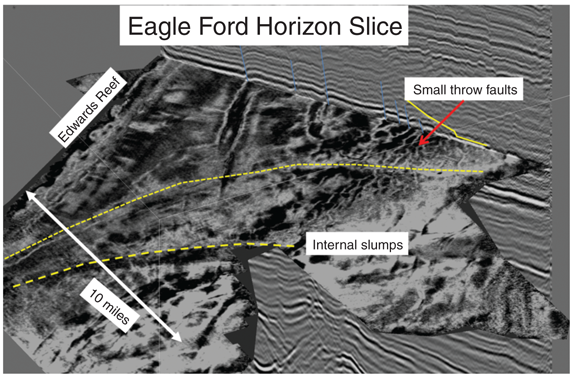
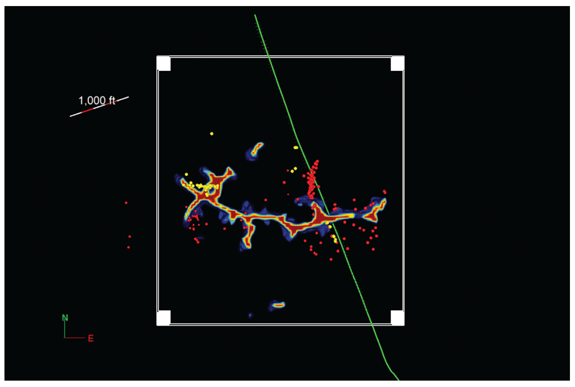
However, today’s generation of seismic data has been designed specifically to address drilling and completion needs by improving the resolution of relatively thin shale layers, and to image the range of faults and fractures that cut them (Figure 1). Additionally, the prestack data have been recorded and conditioned to provide relative reservoir and geomechanical properties such as Young’s moduli, porosity, acoustic impedance and measures of local open fracture orientations.
Geophysical service companies are providing access to this information through their data libraries with cost effective licensing schemes.
Improved Microseismic
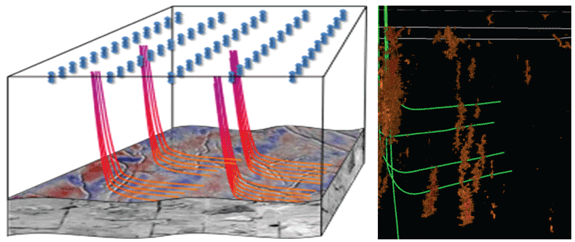
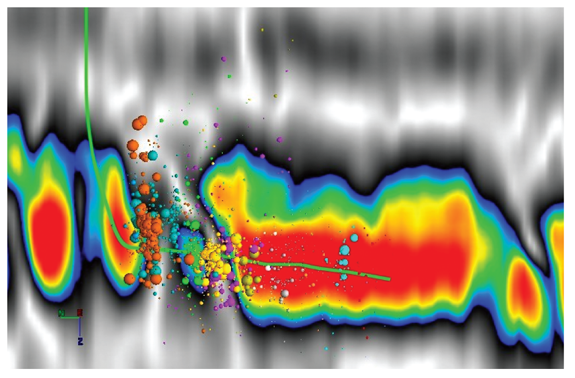
Another enabling trend is the advance of surface microseismic monitoring capabilities, which can provide very accurate spatial descriptions of fracture networks, and have recording geometries that support larger scale frac monitoring in the development phase. Better designs for surface arrays, including both orthogonal sensor deployments and large permanent arrays installed in the near surface, provide improved accuracy and economics for understanding how induced fractures connect with natural fracture regimes in shale formations (Figure 2).
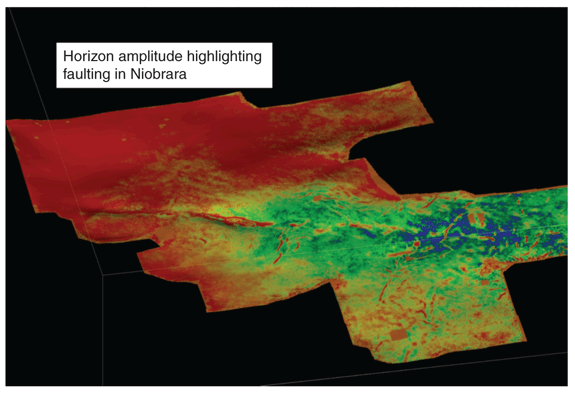
With the improvement in both seismic and microseismic data in the past couple years, advances in data processing, reservoir characterization and integrated analysis can be leveraged to optimize drilling and completion programs. Detailed understanding of shale sweet spots, fairways of higher brittleness, and zones of local stress variation allow for optimized well placement and orientation (Figure 3A).
Improved spatial resolution from seismic-derived interpretations more accurately define the shale’s structural architecture, which in turn supports improved formation contact for horizontal drilling as well as hazard avoidance (Figure 3B).
The advent of larger surface antennae to measure microseismic events created during hydraulic fracturing has spawned new analysis technology that more accurately images the connection of induced fractures with natural fracture networks. Tomographic inversion of passive acoustic energy, for example, provides images that help engineers assess the performance of each frac stage and also understand the interplay of the frac process with the existing fractures (Figure 4).
FIGURE 4
Eagle Ford Tomographic Fracture Image™ from
Single Frac Stage, Overlain on Conventional Hypocenters
These images often define extensive fracture networks adjacent to the lateral being studied, which may be permeability fairways in liquids-rich shales that can be targeted with the next lateral drilled from the same pad.
Data Libraries
Onshore North America has been a hotbed for new seismic acquisition projects as shale development has heated over the past few years. Many of these projects are acquiring high-resolution, high-density 3-D data.
This has enabled a step change in the ability of shale oil operators’ geoscience teams to incorporate rock properties and structural frameworks derived from 3-D seismic into geocellular models over their acreage, along with geological and petrophysical data derived from wells and cores.
An emerging benefit that is helping both geoscientists and engineers establish field-development best practices is jointly analyzing calibrated seismic attributes from these geomodels with existing microseismic data. Until recently, stimulation engineers have analyzed the hypocenters computed in microseismic monitoring independently from contextual 3-D seismic information because those data were not readily available and had not been converted to depth domain.
A standard analysis view commonly employed has consisted of a cloud of hypocenter points surrounding a bore-hole trajectory within an otherwise empty 3-D scene. Now, modern visualization tools allow the microseismic measurements to be co-rendered with geological and 3-D seismic data, while also incorporating engineering pumping curves and proppant volumes.
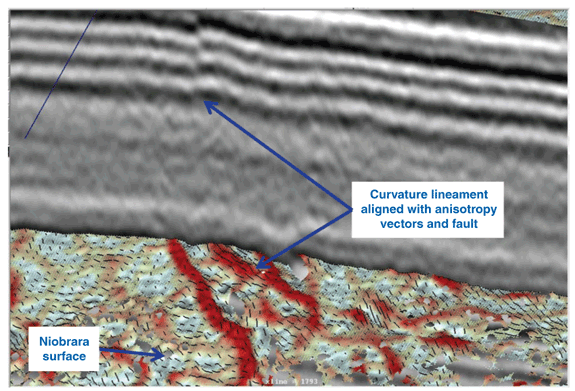
This powerful integration helps enable geoscientists and engineers to work together with all available data types to understand the interaction of engineering decisions with the local geology (Figure 5A).
Integrated Analysis
Unconventional resource consulting teams have noted that integrated analysis of seismic and microseismic data can yield surprising conclusions about methodologies that estimate stimulated rock volumes. In the absence of rich contextual data such as 3-D seismic, the overall acoustic response to the frac is often “shrink wrapped” interpretatively as a proxy for the stimulated reservoir volume.
However, this interpretive quantification does not always correlate well with production performance. It turns out that in some cases, significant amounts of the acoustic energy created by pressure pumping are the result of repeatedly releasing stress along a pre-existing fault. In such cases, the abundance of microseismic hypocenters likely does not indicate a successful stimulation of reservoir rock.
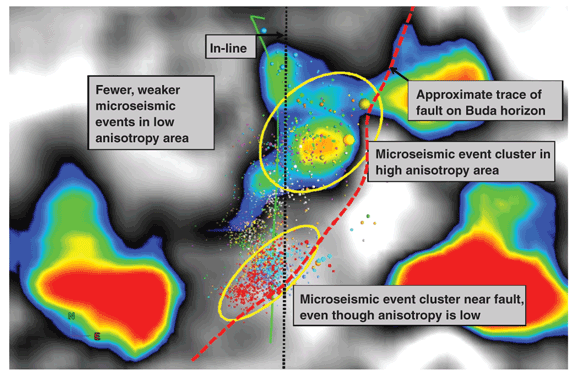
For example, a relatively poor performing well (based on maximum monthly production) was selected from an Eagle Ford study where seismic and microseismic data were analyzed jointly. The signature of faulting was clearly evident from curvature analysis of the base Eagle Ford close to the horizontal well. It was noted that the hypocenter events viewed in isolation exhibited significant acoustic emissions all along the well bore, suggesting a uniform and successful frac application.
However, integrated analysis of key seismic attributes with the microseismic data suggested a different outcome (Figure 5B).
Where the frac intersected zones of high azimuthal anisotropy (an open fracture proxy), many hypocenters were observed, suggesting induced fractures connecting with a natural fracture network. However, toward the toe, where the well crossed a large fault, it appears the abundance of hypocenters may be a product of stress released along the fault. In that scenario, the frac may not have stimulated significant hydrocarbon production from the nearby formation, and the fault may also have acted as a thief zone for the frac fluid.
Changing The Game
Although incorporating 3-D seismic data into the shale exploitation workflow is having an impact on the activities described, the new availability of high quality seismic has yet to dramatically alter the way engineers manage shale field development.
Many integrated studies have provided useful insight into the heterogeneity of shale reservoirs and suggest interesting relationships to observed well performance. However, without demonstrating a more direct relationship of the rock and geomechanical properties to drilling and completions engineering data, the ability to employ integrated information to predict well and reservoir performance is still lacking.
But adapting multivariate statistics techniques to more effectively combine the myriad seismic, petrophysical and engineering attributes now available is changing the game, and is capturing the attention of the engineers.
To highlight the predictive capacity of this technique for well performance, Global Geophysical undertook a 50,000-acre study within its Eagle Ford Basin 3-D library. The goal was to more directly inform drilling and completion decisions by deriving a single predictive model from a nonlinear combination of seismic and engineering variables.
Production and engineering data were loaded for a dozen wells within this area. Maximum monthly production was chosen as an appropriate measure of comparative well performance. Engineering variables such as length of the horizontal wells, lateral depth, and lateral azimuth were loaded into the software, along with approximately 40 seismic attributes at the Eagle Ford level, ranging from simple post-stack measurements such as spectral decompositions, amplitude and phase derivatives to surface curvature and incoherence. Importantly, specialized prestack attributes such as Young’s Modulus, azimuthal anisotropy, and others were incorporated as well.
Linear correlations computed for all the seismic and engineering attributes as well as maximum monthly production were used to screen for the best relationships, and a handful of variables that had notably higher values were selected to build a small portfolio of indicators to drive the multivariate statistics workflow. As expected, none of the linear correlations was much above 0.60, so clearly there was no “magic bullet” attribute in this case.
Predictive Attribute
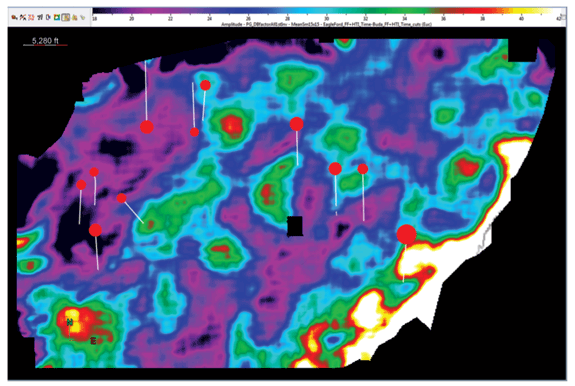
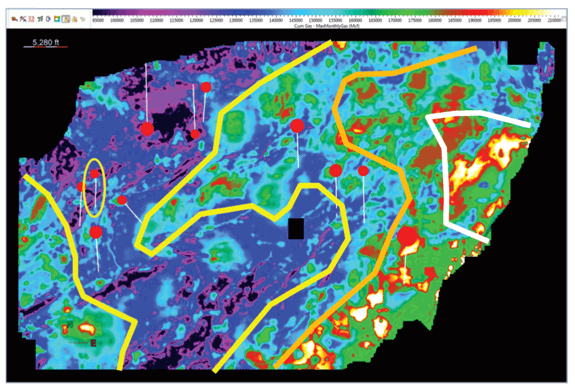
We selected five variables: well bore length, Young’s Modulus (brittleness), azimuthal anisotropy (open fracture proxy), and both 10-hertz and 32-hz spectral decomposition. While it makes intuitive sense that longer well bores provide more contact with the target formation, higher brittleness is an indicator of rock “fracability,” and high velocity anisotropy suggests areas of open fractures. On their own, these attributes were strongly suggestive of possible well performance relationships, but were not conclusive (Figure 6A).
After combining the selected variables using nonlinear regression, this portfolio of promising indicators was transformed into a single attribute whose higher values indicated locations of expected better well performance, and had a high correlation coefficient (0.95) against maximum monthly production. The resulting model attribute was mapped to predict different zones of expected production, which an operator might use to high grade or phase his drilling and completions campaign (Figure 6B). Notably, this predictive attribute contains much of the spatial arising from the seismic attributes.
This study was undertaken in the dry-gas sector of the Eagle Ford, but subsequent projects have been completed successfully using this multivariate statistics approach in the fluids-rich corridor of the play.
As seismic and microseismic technologies continue to mature, and techniques that can effectively integrate geophysical data with production information evolve, we will see a significant change in drilling and completions best practices for unconventional plays. Instead of merely an engineering optimization approach, planning and executing shale field development will more routinely be informed by the intelligent integration of geoscience and engineering data.
This trend will benefit operators with fluids-rich acreage, but may be critical in differentiating operators working with commodity price-constrained dry gas positions.

CHRISTOPHER T. USHER is chief technology officer and senior vice president at Global Geophysical Services. He joined the company in January 2010, bringing more than two decades of operational and technology development leadership in both geophysical services and the exploration- and production-software segment. Usher spent 17 years at Western Geophysical, where he ultimately served as vice president, Eastern Hemisphere data processing, and then as vice president for worldwide technology. In 2000, he moved to Petroleum Geo-Services as president of its data processing division. From 2004 to ’05, he was senior vice president of services worldwide for Paradigm. In 2006, Usher went to work as senior director at Landmark Software and Services, a division of Halliburton, where he oversaw its entire software portfolio. He is a member of the Society of Exploration Geophysicists and the European Association of Geoscientists and Engineers. He holds a B.S. in geology and geophysics from Yale University.
For other great articles about exploration, drilling, completions and production, subscribe to The American Oil & Gas Reporter and bookmark www.aogr.com.


