Marcellus/Utica Update
Marcellus Multistep Workflow Helps Operators Assess Parent/Child Well Interactions
By David C. Johnson, Bryce B. Yeager, Christopher D. Roberts, and Brett W. Fowler
DALLAS–As Chief Oil & Gas LLC initiated full-scale reservoir development of its Marcellus Shale leasehold in Northeast Pennsylvania, it developed a framework to empirically analyze and mitigate parent/child well interference to protect original parent well completions and maximize child well completion effectiveness.
To date, Chief’s collaborative team has cataloged more than 70 offset events and classified 350 frac hits in the dry gas window in Pennsylvania’s Bradford, Sullivan, Susquehanna, Wyoming and Lycoming counties.
The impetus behind this work was a pad in Bradford County, where Chief had completed a single horizontal well in the Lower Marcellus. Almost a year after flowing back the parent well, a development plan was created to offset the original well with a single child well. Given potential interwell interference risk, Chief’s Marcellus technical team was charged with giving management a final recommendation on whether to proceed with completing the child.
In response, a four-step workflow was devised that used standard programs and easily sourced well data. The process consists of:
- Creating macroscopic (well by well) and microscopic (stage by stage) databases and defining specific filter nomenclature;
- Identifying key variables that influence parent/child productivity using correlations;
- Visualizing risk by simulating key variables within a user-defined sample range and populating statistical certainties of net present value; and
- Developing real-time operational strategies to mitigate invasive frac hits.
A major caveat is that the last two steps must be developed independently of each other to ensure that an economic model is built using proven or witnessed interactions free of speculations of new mitigation techniques. If a mitigation technique is proven to affect parent/child interaction, the post-appraised project will be added to the database, allowing the process to go through another iteration. This allows the workflow to have a continuous feedback loop where theories can be validated and refined.
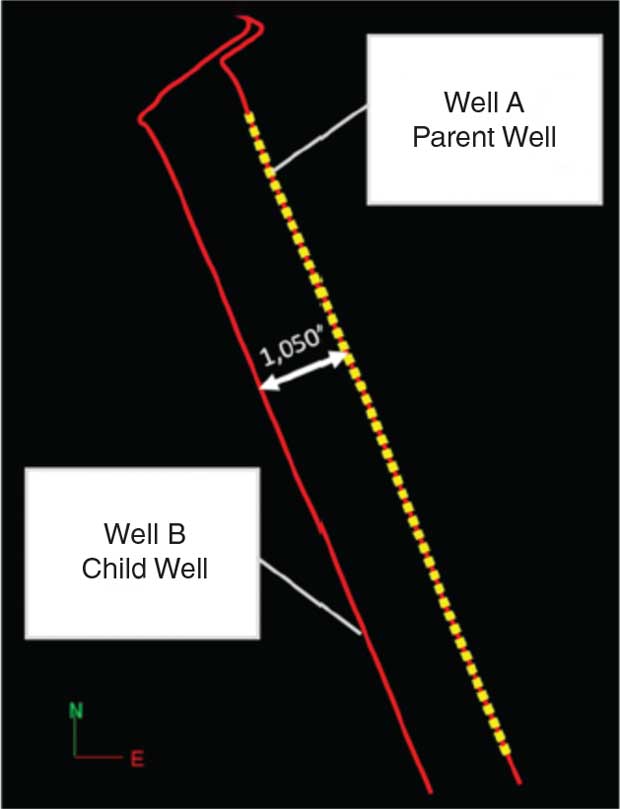
Figure 1 shows the orientation and proximity of both the parent and child wells. Well B has 1,050 feet of lateral spacing offsetting Well A. While the workflow was created in response to this specific application, the approach can be adopted by any operator seeking to quantify parent/child well relationships and mitigate frac hit damage in any unconventional horizontal resource play.
Workflow Processes
The first step of observing offset events involves standardizing the nomenclature and defining terms such as parent well, child well and development well. The ultimate goal is to acknowledge the potential influence of one well’s completion on another well, regardless of timing. In this case, a parent was defined as a wellbore completed with no other laterals within 2,000 feet in a perpendicular direction, and a child is any well completed directly offsetting an existing producing well within 2,000 feet, perpendicular to the parent.
The database, independent of reserve files, is created to document each offset event and the estimated ultimate recovery reserve impact on each well. Once again, nomenclature is important. Specific terminology for production and recovery included “parent uplift” (increase or decrease in parent well EUR after completing the child well), “child uplift” (child EUR minus area type curve EUR, with a positive value representing an EUR above expectations), and “unit uplift” (parent uplift plus child uplift, where a positive value represents a net EUR gain in a unit).
Once built, the database allowed the technical team to study well-by-well effects of 97 attributes from the 70-plus offset events using both operated and nonoperated data. From this process, several variables stood out, but the most important were described as “completion intensity” and “offset severity factor.” In the Marcellus dry gas play in Northeast Pennsylvania, parent wells that originally had been hydraulically fractured with a low completion intensity (high stage length and low proppant loading) appear to react more positively than parent wells with more modern, higher-intensity completions. Moreover, when it comes to child well performance, the earlier the parent well is offset the more favorable the overall outcome.
Specifically, the information suggests that wells should be offset before the parent well’s cumulative production exceeds 400 million cubic feet per 1,000 lateral feet. The amount of production varies with completion design, especially the intensity of the parent well’s completion, but that means a 6,000-foot child well directly offsetting a parent 1,200 feet away should be stimulated and flowed back before the parent reaches 2.88 billion cubic feet of cumulative production or the operator will risk a net loss.
Moderating Impacts
The goal of creating the microscopic stage-by-stage database was to develop criteria to catalogue frac hits as “invasive” (resulting in lost value) or “benign” (a poroelastic effect with no lasting negative impact), and design a real-time completion strategy to moderate the impact of invasive frac hits. This database was populated with historic pressure data and other variables recorded in parent wells in the area. The analysis showed that all wells that had lost EUR experienced average buildup pressures greater than 500 psig, while all the wells that maintained or slightly increased EUR had average buildup pressures below 500 psig.
This correlation was particularly interesting on unit uplift, suggesting a direct connection between the pressure on a parent well and the overall performance of the unit (parent and child). One interpretation is that a child well’s frac geometry and a parent well’s original completion could both be influenced by an invasive frac hit on the parent. At lower average buildup pressures, frac hits potentially could benefit both a parent and child well.
After building and reviewing available data through both a macroscopic and a microscopic lens, Monte Carlo simulation was performed to manage the multiple variables and model the overall economic outcome. The simulation was run through 10,000 iterations by randomly selecting the variables based on their individual distributions and probability of occurrence based on the offset databases.
Well A’s percentage of EUR produced at the time of offset was historically low given other offsets in nearby parts of the field, and its geological complexity was very low, with a fairly clean cross-section. Nevertheless, there was a wide range of parent and child uplift possibilities, even when filtering for a specific situation. The results were binned to calculate individual probabilities and plot cumulative probability frequency data. The P30 case was selected as the most likely outcome based on a combination of qualitative and quantitative factors.
Far-Field Diversion
After management approved plans to proceed with completing Well B using the same higher-intensity design as Well A, the team began looking at a real-time solution to mitigate potentially invasive frac hits. Ultimately, the decision was made to deploy a far-field diversion material to maintain low buildup pressure and bridge invasive communication paths from the child well to prevent damaging frac hits on the parent well. A silica flour mixture of 100- and 325-mesh grain sizes was selected for field trial. This nondissolving diversion media is cost-effective and requires only small operational adjustments to adopt during fracturing.
Well A’s completion design is typical for Bradford County. The plug-and-perf slickwater frac had pumped 100-mesh sand as 7% of total proppant and 40/70 Ottawa white sand as the remaining 93%. The pump schedule had included a pad volume after formation breakdown, a small acid flush for perforation cleanup, followed by a proppant-laden fluid with sand concentrations increased in a stair-step fashion. Well B would mimic the parent well’s design, including stage length, proppant loading, fluid volume and cluster design. The only change would be adding a far-field diverter as a fraction of total sand volume. This approach ensured that the added far-field diverter would be the primary variable tested.
The goals of the field trial on the two-well pad included:
- Adding far-field diverter to the pump schedule without any environmental, health and safety impacts or efficiency losses;
- Monitoring the parent well’s casing pressure in real time and maintaining buildup pressure below 500 psig;
- Executing a real-time strategy on location to identify an invasive stage presence and deploy additional mitigation protocols if needed; and
- Maintaining or improving the unit economic portfolio for well group A and B.
Well A was shut in for 11 days prior to starting completion activity on Well B. During this time, pressure increased from 1,000 psig while flowing to 2,100 psig. Fluid levels were determined to ensure a clean wellbore and a consistent fluid level for hydrostatic calculations. A backpressure valve was installed in the tubing hanger to isolate the 5,000 psi-rated production valves from potential high frac hit pressures.
The second operational challenge was to monitor and record Well A’s casing pressure in real time. An electronic pressure sensor was installed under the backpressure valve/tubing hanger. Since Well B is on the same pad as Well A, the frac spread operator, Universal Pressure Pumping, ran a data line to its frac van to enable high-frequency casing pressure monitoring. This allowed on-site and online users of the company’s virtual frac database to plot casing pressures against other recorded trends. All data was synchronized automatically, ensuring utmost accuracy in comparing rates, pressures, surface/downhole concentrations, etc.
Procedures were developed to facilitate the on-site storage and handling of the silica flour, which was packaged in 2,000-pound “supersacks.” After completing an initial 0.5 pound per gallon, 100-mesh stage, 2,000 pounds of diverter material was slowly released onto the sand belt and mixed with 100-mesh sand. The combined material then was conveyed to the blender and mixed to a 1.0 ppg slurry.
Field Trial Results
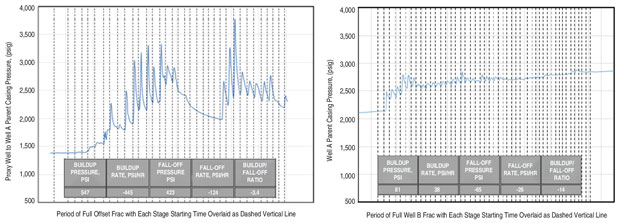
Pressure data was monitored for each subsequent stage as Well B was completed. While frac hits were observed in every stage (right-hand chart in Figure 2), they were much less dramatic than those in a nearby proxy example that had no diversion agent additives (left-hand chart in Figure 2). The average buildup pressure was 88 psig, well below the 500 psig goal. Two early stages did show a buildup greater than 300 psig, so future jobs may consider a lower goal, for a more aggressive mitigation program.
FIGURE 2
Parent Casing Pressure Responses to Child Stage Starts for Proxy Example (Left) and Well A/B (Right)
All stages were pumped to 100% of designed proppant placement. In nearby wells that had not used a diverter, the child well had a higher average treating rate than the parent, despite similar average treating pressures in both wells. The opposite is true for the Well A/B diverter trial. The rate for Well B was significantly less than the parent at similar average treating pressures. The phenomenon could be random, or it could be an indication that the diverting material successfully prevented preferential fracture length growth into depleted zones, increasing pressure and/or limiting rate when max pressure is a constant.
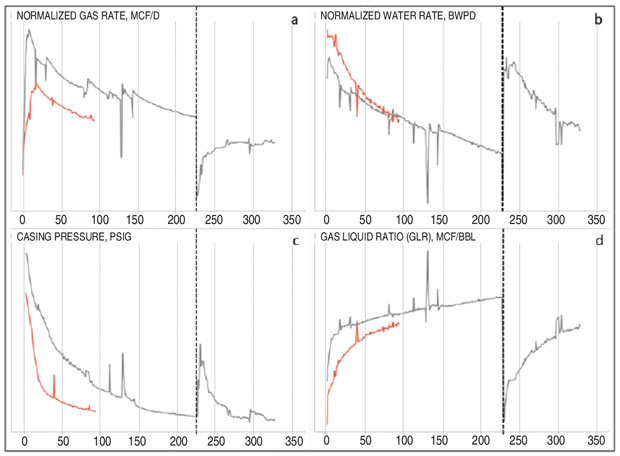
Well B has underperformed to type curve expectations. With a lower normalized rate and lower flowing casing pressure, its production was 30% below the area type curve as of November 2019, shortly after completing the well. Conversely, Well A’s performance has exceeded expectations. Figure 3 plots the normalized gas rate in Mcf a day (top left), normalized water rate in barrels a day (top right), casing pressure in psig (bottom left), and gas-to-liquid ratio (bottom right). Experience in this part of the Marcellus suggests that as the water rate increase in Well A subsides, the gas rate will stabilize at an almost consistent rate. This is a good indication of friction-dominated flow, where friction from a higher water cut holds back the gas.
These results underscore the difficulty of accurately predicting individual offset well outcomes. The best correlations typically were seen with the unit uplift factor. The same is true when looking at the original Monte Carlo simulation predictions and how they relate to actual production results. Even with overpredicting Well B and underpredicting Well A, the unit uplift prediction was within 2% of the actual production outcome.
Despite the child well’s underperformance, the parent well’s success and overall total unit production merit a continuation of far-field diversion trials to better understand the impact on parent completion preservation and child well fracture uniformity. As demonstrated in this project, the workflow developed by Chief Oil & Gas has the ability to identify key variables, accurately measure risk, and aid in implementing mitigation protocols. By utilizing the continuous feedback loop, an operator can validate or refine theories given any magnitude of operations.
Editor’s Note: The authors acknowledge Universal Pressure Pumping’s Neil Boyer, Brad Rowley, Kasey Ferguson, Joe Pinkhouse and Dane Clark, as well as the members of Universal’s Spread 119, for their operational excellence on the Bradford County field trial project. For additional information on the workflow developed in support of the project, see SPE 199717, a technical paper originally prepared for presentation at the Society of Petroleum Engineers’ 2020 Hydraulic Fracturing Technology Conference & Exhibition, held Feb. 4-6 in The Woodlands, Tx.
DAVID C. JOHNSON is a senior operations engineer at Chief Oil & Gas LLC based out of Dallas. Since joining the company in 2016, he has worked with the technical team, focusing on completion operations, production surveillance and unconventional asset development/research. He began his career with Anadarko, working across Pennsylvania, Ohio and East Texas, where he pioneered several field-based engineering roles for the company’s southern region. Johnson graduated from Marietta College in 2011 with a B.S. in petroleum engineering.
BRYCE B. YEAGER has worked in the oil and gas industry for 18 years and is drilling and completion manager for Chief Oil & Gas LLC. In this position, he oversees all of Chief’s drilling, completion, workover and water operations in the Marcellus shale. He is also accountable for ensuring Chief’s operations are carried out in a safe, environmentally responsible and regulatory compliant manner while continuously striving to improve operational efficiencies. Through previous positions within Chief, Chevron, Energy Corporation of America and Halliburton, Yeager has been involved directly in various aspects of oil and gas operations including production, EH&S, and asset development. He has worked in the Appalachian Basin, as well as the Michigan and Denver-Julesburg basins. Yeager graduated from Pennsylvania State University in 2002 with a B.S. in chemical engineering.
CHRISTOPHER D. ROBERTS has 23 years of experience in the oil and gas industry and is the completion superintendent for Chief Oil & Gas LLC. He began working for Chief Oil & Gas as a consultant in March 2010, and joined the company in August 2014. He is responsible for coordinating resources to ensure timely, efficient operation as well as ensuring that all completion operations comply with regulatory requirements and organizational goals. Prior to working in the Marcellus, Roberts worked for Halliburton as a tool specialist in Texas and Louisiana.
BRETT W. FOWLER has 24 years of completion and workover experience in the oil and gas industry and is an assistant completion superintendent at Chief Oil & Gas LLC based out of the company’s Northeast regional office. He supervises all completion and workover related actives in the Marcellus Shale and specializes in downhole remediation, project execution and contractor management. Throughout Fowler’s career, he has had the opportunity to work on conventional plays and unconventional assets across Kansas, Colorado and Pennsylvania.
For other great articles about exploration, drilling, completions and production, subscribe to The American Oil & Gas Reporter and bookmark www.aogr.com.


