Permian Driving Frac Sand Supply Shift
By Tim Beims and Colter Cookson
On a hydraulic fracturing job site, the sand king is a critical piece of machinery at the heart of the stimulation operation. It “feeds the beast” by taking proppant from an endless cavalcade of trucks so that it can be conveyed to blenders and mixed with fluid for pumping down hole. It is the final link in a long and winding proppant supply chain that typically originates in Upper Midwest states with no oil or gas reserves, but massive deposits of a resource essential to producing unconventional formations: high-purity silica sand that keeps induced fractures propped open and hydrocarbons flowing from low-permeability rocks.
Wisconsin’s 44 active mines account for nearly half the nation’s total installed frac sand capacity, according to Thomas P. Jacob, a senior research analyst in IHS Markit’s upstream research division. In the realm of frac sand mining, the Badger State is undisputed king. The quartz-rich northern white sand sourced within its borders–and to a much lesser degree, neighboring Minnesota and Illinois–has long demanded a premium price in shale plays. “Its physical properties make northern white ideal for well stimulation,” he says.
At any point in time, odds are that unit trains being loaded with the “good stuff” at central Wisconsin mining facilities are destined to ride the rails for the long haul south to the Permian Basin–far and away the biggest frac sand consuming market.
Industry metrics indicate that Permian proppant intensities now are averaging on the order of 1,900 pounds (nearly 1 ton), but are as high as 5,000 pounds (2.5 tons) per lateral foot. A run-of-the-mill Wolfcamp horizontal consumes 12 million-14.5 million pounds (6,000-7,250 tons) of proppant, requiring a logistics infrastructure on the scale of 300 truckloads to service a single well. Given the efficiencies of multiwell pad operations, a single frac crew can place down hole 6 million pounds or more of sand a day, emptying 130 dry bulk trailers every 24 hours.
Production also is upsized, with operators reporting initial daily production rates as great as 5,300 barrels of oil equivalent from Wolfcamp wells. “A horizontal well in 2017 is not what a horizontal well was in 2014,” Jacob states. “Well productivities are much higher. A lot of that has to do with do with high-grading. Companies have been targeting their best acreage in the best parts of the plays. But it also has to do with process and technological innovations made out of necessity to get the most out of every well.”
The most apparent innovations are related to lateral length and completion design. “There is a clear positive correlation between proppant volume and well productivity,” Jacob says, noting that U.S. proppant consumption set a record this year, and is expected to blow right past that historic peak next year. Longer laterals, denser frac stage spacing/higher stage counts, and increased proppant intensities per stage are driving proppant consumption growth and resulting in what he describes as “a lot longer and bigger wells in the best parts of the plays.”
King Of Demand
These trends are particularly evident in the stacked tight oil plays in the Delaware and Midland sub-basins, Jacob observes, distinguishing the Permian as the reigning king of frac sand demand. By IHS Markit estimates, he says West Texas accounts for 37 percent of all U.S. proppant demand, putting away more sand every day than the next two largest consuming basins–the Eagle Ford and Marcellus/Utica–combined.
The logistical catch is that Google Maps shows that 1,313 miles lie between Chippewa County, Wi., and Midland County, Tx. A cardinal rule in logistics management is that the supply chain grows increasingly complicated the longer it stretches, the more volume it must deliver, and the faster it must move. So how much demand pull is at the end of the line in the West Texas, and how quickly are Permian horizontals churning through frac sand supplies?
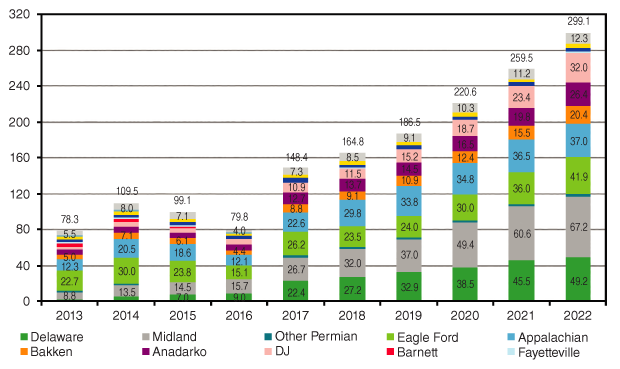
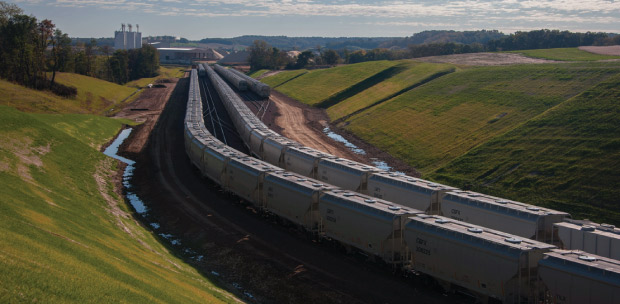
Given increasing well sizes and proppant densities, IHS Markit estimates that Delaware and Midland basin operators will consume 50 billion pounds of proppant this year–doubling 2016’s total and quadrupling 2014’s gross amount (Figure 1). That breaks down to 137 million pounds (68,500 tons), or the equivalent of more than 600 railcars (four standard 150-car unit trains) worth of sand every day of the year.
Looking forward, Jacob says Permian demand is expected to maintain its upward climb, reaching 119 billion pounds by 2022 to account for 40 percent of the total projected amount for all U.S. shale plays. At that forecasted level of consumption, Permian operators would be pumping proppant at a daily rate of 326 million pounds (163,000 tons, or enough to fill 1,500 railcars/10 unit trains).
In short, the Permian has been–and is forecast to remain–the ultimate growth market for frac sand, according to Jacob, who notes that it was the lone region to grow proppant demand through the darkest days of the 2015-16 activity downturn. To streamline supply-side logistics and reduce delivered costs, he reports that a long list of companies is working to make West Texas a new frac sand supply epicenter by opening mines right in the backyard of North America’s hottest horizontal resource plays.
IHS Markit counts 17 active “brown sand” mines in operation across the Lone Star State (mostly in East and South Texas), but has identified a roughly equal number of new in-basin mines that have been announced within the greater Permian’s Central Basin Platform that separates the Delaware and Midland sub-basins. Incidentally, some of the West Texas mine sites are owned and operated by the same companies mining northern white in the Great Lakes/Upper Midwest.
“Realistically, we do not expect all the announced in-basin capacity to come on line, but a lot of it will, and soon,” Jacob posits. “It will have a big impact on the proppant supply chain in all parts of the country.”
Activity Indicators
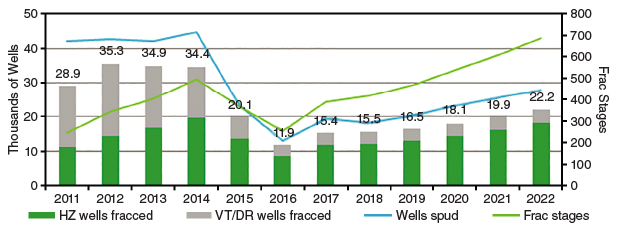
Looking at activity trends as tracked by IHS Markit, it is easy to see why proppant suppliers are eager to expand capacities. Driven by activity in West Texas, Jacob says IHS Markit predicts that U.S. drilling and completion activity will build on the momentum of 2017, when the number of well spuds jumped 61 percent and the number of horizontal wells hydraulically fractured soared by 57 percent year over year (Figure 2).
Over the coming 12 months, IHS Markit estimates that operators will regulate the drilling pace to allow completions to get caught up, projecting the number of new wells to decline modestly and the number of horizontal wells fractured to increase slightly compared with 2017, Jacob reveals. Longer term, however, he says IHS Markit forecasts healthy year-over-year growth in the numbers of wells drilled and fractured, returning annual horizontal well completion counts for 2019-22 to levels roughly on par with the 2012-14 timeframe.
“We also see the inventory of drilled but uncompleted (DUC) wells shrinking in 2018,” Jacob remarks. “There always will be DUCs because of the nature of pad drilling and the lag time between drilling and completing. But the U.S. frac fleet has struggled to keep up with the drilling pace through most of 2017. Lag times are longer and there have been bottlenecks in frac fleet availability and proppant supplies. Because of that, a lot of the DUC buildup is unintentional. Frac crews should start catching up.”
According to Jacob, a total of 1.6 million horsepower in new-build frac capacity has entered service this year, helping alleviate regional supply-side tightness. “With the new-build capacity, our latest projections put the total U.S. land frac fleet capacity at 17.9 million horsepower. However, we think 1.9 million of that total horsepower will remain in cold stack and not return to service.”
For an industry hoping to finally break into a sustained recovery mode, consistent activity levels, fewer DUCs and new investments in fracturing horsepower are all welcome news. However, Jacob points to two prominent trends largely defining future well completion activity in IHS Markit’s analysis: The total numbers of frac stages in horizontal wells, and proppant volumes pumped per well, which surged by 76 percent and 28 percent, respectively, through the first part of 2017.
“We project that the number of frac stages pumped will hit an all-time high for any calendar year by mid-2018, and keep growing through 2020,” Jacob says. “Given the longer laterals and increased stage counts, it is no surprise that the average proppant mass per horizontal well also is increasing, driving a 103-percent jump in frac sand demand in 2017. We see proppant demand continuing to grow at a 12-13 percent compound annual rate through 2020.”
Jacob credits EOG Resources Inc.’s Eagle Ford team with pioneering the slickwater frac designs with high proppant concentrations quickly that have become the de facto standard in shale plays. “There is always a set of operators at the forefront, and then everyone else eventually follows. We think part of the exponential increase in proppant intensity levels indicates that the rest of the market is catching up with the leaders,” he offers.
But not all frac sand is valued the same, Jacob notes. In resource plays, finer grades of 40/70 and 100-mesh grain sizes have expanded market share to 77 percent. “The move toward finer-mesh sands goes hand in hand with the move toward slickwater chemistries,” he comments. “Coarser grades require more complex and costlier gel systems to transport the sand into the formation.”
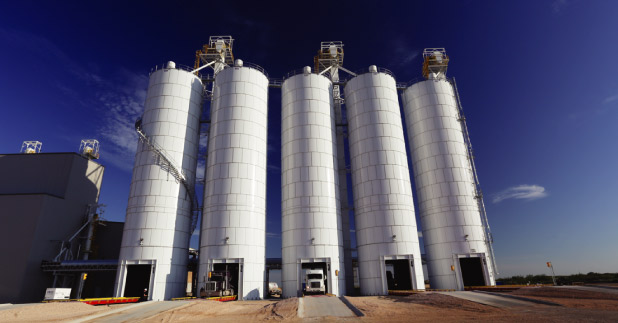
These trucks are loading at the first in-basin sand mine serving the Permian Basin. Hi-Crush, the mine’s operator, says the Kermit, Tx., facility can produce as much as 3 million tons of high-quality fine mesh sand a year.
Golden Opportunity
The golden opportunity to serve booming local demand explains why companies are lining up to build new fine-grade frac sand capacity in West Texas. The gross announced annual capacity of all the proposed brown mines is almost 70 million pounds (all of it either 40/70- or 100-mesh), which Jacob says probably far overshoots the required need.
“There are questions about how much of this announced capacity will make it to market,” he offers. “At best, the Permian could see 40 million tons of demand in 2018. Our forecast calls for 38 million tons of effective new Texas supply to come on line next year, with all the mines located in proximity to Midland and Delaware plays. That is still a lot of new supply.”
Looking at American Petroleum Institute specifications such as sphericity and turbidity, Jacob says northern white sand has a crucial advantage over brown sands: greater compressive strength and higher crush resistance to keep fractures propped as wells produce. The biggest disadvantage is cost. About half the delivered cost of northern white in the Permian can be attributed to rail transportation. IHS Markit estimates that the median delivered cost of Texas brown sand will be $78/ton this year for the Delaware and Midland wells, he says.
Moving the point of origin from 1,300 to 30 miles away from the well not only simplifies logistics and reduces delivered costs, but may promote the concept of real-time treatment optimization, Jacob predicts.
“Locating mines close to wells creates a more dynamic ‘just-in-time’ market to respond much faster to changes, but you still have to get all that sand trucked to site. Last-mile logistics have always been the challenge in proppant supply,” he explains. “A mine that supplies 3 million tons a year requires 120,000 truckloads. Do we have the road infrastructure, trucks and drivers? The logistical limitations will determine whether supply can be made responsive enough to accommodate real-time adjustments to a frac job.”
Moreover, as with any new solution, Jacob cautions, Permian brown sand has initial risk factors. “The new in-basin sand is very different than northern white and other brown sands,” he states. “This is an entirely new type of frac sand, and it remains to be seen what effects it will have on long-term well performance in Delaware and Midland plays.”
The in-basin mines also are differentiated by the fact that they are intended to serve only the local market. “The sand will not be shipped to the Marcellus or Niobrara. The cannibalization of Permian demand from northern white to in-basin brown has major implications for sand mine operators in the Great Lakes/Upper Midwest,” he goes on. “It probably means a 6-7 percent decline in northern white prices next year.”
The increased availability and lower costs could benefit operators in the Marcellus/Utica, Bakken, SCOOP/STACK and other plays that consume northern white sand, Jacob adds. Precisely as in the Permian, with its newfound supply of local brown, Jacob says break-even costs ultimately may fall in other basins that use northern white, considering that proppant can represent as much as 30 percent of total completions costs.
“Going forward, our models show oil prices averaging in a range of $50-$55 a barrel during the next 18-24 months. A lot of operators are comfortable with that because they have reduced their break-even cost to a point where they can profit at that price level. Lower proppant prices would help keep well costs in check,” he concludes. “Should prices go above $55, operators would be positioned to capture a lot of upside.”
As long as operators favor completion designs that combine fine mesh sand with coarser grades, unit trains will continue carrying premium northern white sand into the Permian Basin. By augmenting this traditional premium sand with locally-mined fine reserves, sand providers say they can simplify proppant delivery logistics and reduce completion costs. As more West Texas sand mines come on line, they may reduce the Permian’s need for fine mesh northern white, allowing some to be sent into other demand centers, such as the Marcellus and Bakken.
First Permian Mine
The first Permian Basin sand mine, which is located near Kermit, Tx., opened in July and reached its nameplate capacity of 3 million tons a year in October. According to Hi-Crush, the operator, the mine’s reserves contain 105 million tons of high-quality fine mesh sand.
Hi-Crush Chief Executive Officer Robert Rasmus points out that many other sand providers have announced plans to open Permian Basin sand mines. “These mines are driven by customer needs,” he says. “Because of their geographic proximity to wells, local mines can simplify the logistics involved in getting sand to the well site, substantially reducing costs for oil and gas producers and upstream service companies.”
In-basin sand mines mitigate the need to put sand onto a train, ship it to a terminal and unload it into storage silos, Rasmus details. “Depending on where the alternative sand is coming from and the types of services used to transport it, this could reduce costs by 25-40 percent,” he calculates.
Despite those savings, Rasmus says northern white will continue to play a vital role in Permian Basin completions. “Most Permian Basin sand deposits are primarily 100 mesh. While there are a few operators who complete wells using almost entirely 100 mesh, most prefer to combine it with other grades, particularly 40/70,” he argues.
The Permian’s 100-mesh sand has quality comparable to northern white, but at the 40/70 grade size, Rasmus says northern white retains its traditional edge. Because it has a more even distribution across the sieve, with a mix of 40-, 50-, 60- and 70-mesh sand grains rather than a high concentration of fine mesh sand, it is more attractive to most operators. Thus, Rasmus predicts many Permian operators will continue to buy northern white.
With that in mind, he says Hi-Crush made the decision to produce only 100 mesh sand at its Kermit facility. “Producing one grade simplifies the production process and reduces the facility’s infrastructure needs, creating cost savings we can pass on to customers,” he comments.
In-basin sand mines may help alleviate supply constraints outside the Permian Basin. “Both the Marcellus and Bakken are clamoring for 100 mesh that currently goes to the Permian,” Rasmus says. “As Permian mines come on line, we can see a situation where they displace 10 million tons of northern white 100 mesh, allowing it to be sent to other markets.”
Logistics’ Ascension
With completion designs calling for pumping larger quantities of sand per well, and the operational efficiencies of multiwell pad fracturing consuming large volumes in a short time, logistics has become increasingly important, Rasmus observes. “The frac sand market has become a service market,” he states. “Customers always will be cost-sensitive, but they also need to know the sand will show up when they need it, in the quantities and grades they require.”
To provide supply surety, Rasmus says some of the best sand mining companies are investing in logistics infrastructure and expertise. For Hi-Crush, that effort has included leasing railcars and building Class I rail terminals in the Permian Basin, Marcellus/Utica and other regions. “By owning and operating terminals, we can eliminate middle men, which reduces costs and gives the customer one point of contact and accountability, improving customer service,” Rasmus explains.
In the Permian, the company has terminals in Odessa, Big Spring and Pecos. “The Pecos terminal is the first unit train-capable terminal with silo storage serving the southern Delaware Basin,” Rasmus reports. “The silos are capable of being segregated into 40/70-, 30/50- and 100-mesh sands. By storing three grades on site, we can respond to last-minute changes in completion designs.”
According to Rasmus, both sand providers and railroad companies are looking to expand the amount of sand delivered by unit train. “Unit trains are three-four times faster than manifest trains and easier to manage for both the shipper and the railroad company,” he says.
As part of their logistics offerings, a few sand providers are helping operators move sand from the terminal to the well site. Instead of using pneumatic trailers to deliver and unload the sand, Rasmus says Hi-Crush employs an innovative containerized system that can be transported on flatbed trucks, which are more common and affordable. These containers have funnel-like openings at the bottom that allow them to empty by gravity onto a conveyer belt or directly into the hopper, providing fast-unload capability.
Importantly, the fully enclosed container system eliminates more than 90 percent of the silica dust emissions associated with traditional pneumatic methods, enough to comply today with U.S. Occupational Safety & Health Administration limits on silica dust exposure that will go into effect in 2018, Rasmus reports. He adds that the solution is much quieter than pneumatic trailers, a boon in areas where wells are near homes and businesses.
But it is efficiency that is driving the containers’ growing popularity. “Using the containers, we can unload 25 tons in five to seven minutes,” Rasmus enthuses. “That is much faster than pneumatic trailers, which take 30-45 minutes to unload, long enough they must often idle in lengthy lines. The new method eliminates the lines and the associated standby charges and truck congestion.”
Rasmus adds that the containers can be delivered to the site ahead of a project, enabling operators to guarantee sand availability and spread truck traffic out to minimize inconveniences to local communities.
“By combining the specialized containers with operational best practices, we are able to deliver 7-10 percent more sand on each truck,” Rasmus says. “For a plant that produces 3 million tons of sand a year, like the Kermit facility, that is enough to potentially take up to 12,000 trucks off the road.”
For other great articles about exploration, drilling, completions and production, subscribe to The American Oil & Gas Reporter and bookmark www.aogr.com.


