


Real-Time Changes To Completion Designs Are Poised to Unlock Value
By Craig Cipolla and Mark McClure
Completion optimization has long been focused on two primary techniques. The first looks at historical well performance or field trials to extract lessons for future wells, while the second deploys advanced measurement techniques to collect detailed data on specific wells. These techniques have a long history of leading to more reliable models and accelerating design improvements.
But even with increasingly sophisticated data analysis tools, there is a significant lag between collecting data and adjusting completion designs to improve performance. To shrink the gap between information and action, completion teams have spent decades experimenting with ways to turn accessible data into downhole insights they can act on in real time or at least between stages.
Today, the possibilities for real-time optimization are expanding. Thanks to ongoing work by operators, service companies and academic institutions, new technologies are bringing down the cost of generating useful measurements in real time. By applying these measurements to calibrate increasingly efficient fracture and completion models, completion teams are getting faster feedback on completion effectiveness and the resulting fracture geometries. This feedback has the potential to significantly improve proppant distribution and well performance if the industry can leverage it efficiently.
Prerequisites for Success
Real-time data and more accurate models only matter if the completion team has the capability to act on the information. This necessitates reliable techniques for controlling fracture geometry, as well as the means to make changes quickly.
That need for speed is prompting Hess to pioneer autonomous and intelligent fracturing (AIF). By connecting optimization models to fracturing operations and empowering those models to automatically adjust some parameters, AIF will enable more repeatable operations. It achieves that goal partly by mitigating common human biases, such as variations in rate during breakdown and reactions to changes in treatment pressures.
AIF is becoming possible because of efforts by hydraulic fracturing companies of all types to automate their operations and provide rich data. Integrated measurement technologies enable AIF to assess the situation and identify beneficial changes, and automation lets those actions be implemented rapidly.
For AIF to deliver attractive returns, the changes it makes or recommends need to materially improve completion effectiveness. For example, semi-real-time (i.e., after each stage) changes can alter the perforation strategy, stage length, treatment design and/or cluster spacing. Real-time recommendations can alter the proppant type or concentration, the rate or the fluid viscosity.
AIF also may deploy diverters to improve fluid distribution between clusters or optimize far-field fracture geometry. Numerous studies have highlighted the application of diverters, but they are not yet routinely applied because of how unpredictable the results can be. The more robust measurements and models that are enabling AIF also may support more extensive use of diverters, but for now, many operators likely will continue focusing on optimizing limited entry perforation designs.
Regardless of the form its recommendations take, AIF has the potential to get completion teams closer to the perfect frac stage, meaning one that distributes the same amount of fluid and proppant in every cluster. In this article, we will focus on what AIF entails and why it’s becoming an increasingly realistic possibility. In a follow-up article for AOGR’s September issue, we will discuss two modeling studies that suggest AIF will unlock substantial increases in production and net present value.
The Vision
In an early iteration, Hess’ vision for AIF involved developing a machine learning model to accurately predict fracture treatment pressures and provide recommendations for improving subsequent stages. Figure 1 shows the model, which was successfully assessed in 2021. The data requirements for this model were fracture treatment design and completion parameters. Semi-real-time inputs included rate, treating pressure, proppant concentration and friction reducer loading.
FIGURE 1
Current State of Autonomous Intelligent Fracturing
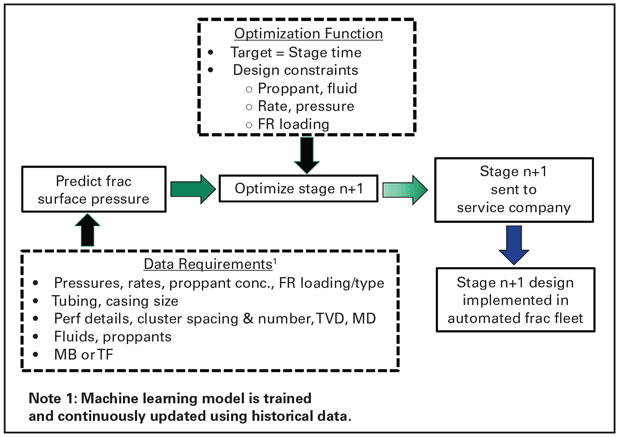
The model’s optimization function was simple, providing recommendations to adjust proppant ramp, rate and FR loading to reduce stage time. However, this simple model did not result in significant improvement when compared with typical recommendations from completion supervisors. For AIF to justify the cost and work that goes into it, it needs to have a bigger impact.
Figure 2 shows Hess’ current vision for AIF, illustrating the ambitious goal of predicting stage-level production to enable an optimization function that targets value. Realizing this vision will require much more sophisticated and fast models that can predict cluster-level fracture geometry. These models require real-time or semi-real-time measurements of fluid and proppant volume injected into each cluster and measurements to constrain fracture length and morphology.
FIGURE 2
Hess’ Vision for Autonomous Intelligent Fracturing
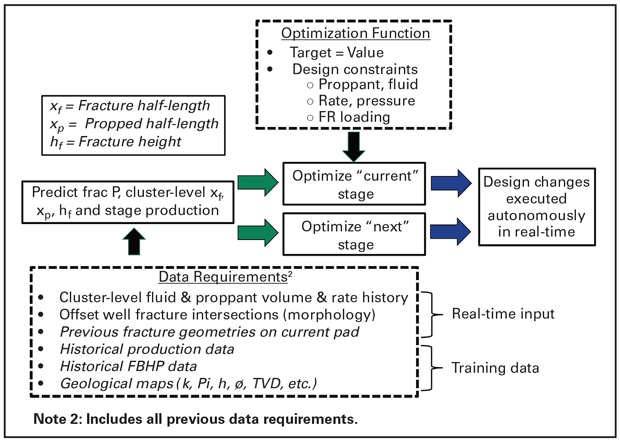
Getting those measurements can be expensive. For now, the only reliable real-time measurement of cluster-level fluid and proppant distribution is cemented fiber optics. The most reliable real-time estimates of fracture geometry and morphology also come from fiber optics, by way of offset well strain measurement and microseismic. This highlights two hurdles to achieving the AIF vision:
- Low-cost measurement of cluster-level fluid and proppant volume for every stage; and
- Real-time fracture and production models.
Fortunately, ongoing work aims to develop low-cost measurements that can estimate cluster-level fluid and proppant distribution. And there are efforts to correlate offset well pressure behavior to fracture geometry and morphology. The development of these measurements and other low-cost data collection techniques will supply the required real-time model inputs for AIF.
Rapid Modeling
Without fast hydraulic fracture models, the AIF vision may remain beyond reach. Even with today’s computing power, plug and perf completions in unconventional plays are too complex for completion teams to rely on a brute force approach to simulating them if they want real-time information.
One current effort to speed modeling focuses on using fracture geometry and morphology measurements in the Bakken to develop simple proxies for fracture geometry and morphology. Although the details of fast fracture modeling are beyond the scope of this article, we will provide a quick introduction to this work.
Figure 3 illustrates the measurements and relationships used as inputs to calibrate the fast model. The left side of Figure 3 shows that global fracture length can be predicted using the stage-level fluid volume injected (upper most curve).
FIGURE 3
One Approach to Fast Fracture Modeling
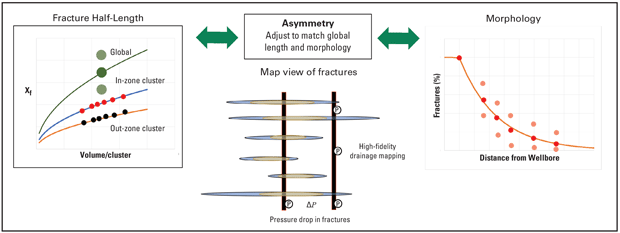
A simple length-volume relationship was developed using microseismic and fiber optic measurements and represents the average fracture half-length for a stage as a function of fluid injected (dark green dot). The length of individual fractures in each stage is not known (or measured). However, fracture morphology using offset well fiber-strain data provides measurements of how many fractures are propagated as a function of distance from the wellbore (right graphic in Figure 3, with dark red dots representing the average behavior).
The figure’s center graphic shows a map view of fracture morphology and asymmetry.
The fracture length-volume and fracture morphology relationships, which can be represented using simple equations or proxies, are combined with a statistical algorithm to match the average behavior and variability of the actual measurements. This global variability is represented by the light green dots in the left-side graphic and light red dots in the right-side graphic.
The last component is developing cluster-level length-volume relationships for in-zone and out-zone fracture growth. The relative difference between in-zone and out-zone fracture growth can be measured, but the length-volume curves are calculated by the algorithm.
With inputs of volume injected into each cluster from permanent fiber optics or estimates of stage-level fluid uniformity indexes from surface measurements, the model predicts the length of each fracture using the cluster-level in-zone and out-zone curves. This is illustrated in Figure 3 for a six-cluster stage (left graphic, bottom two curves), with different fracture lengths for each cluster predicted using the in-zone (small red dots) and out-zone (small black dots) length-volume curves. The model then uses variations in asymmetry for each fracture to match the morphology behavior (right graphic in Figure 3).
By introducing sufficient cluster-level and stage-level variations in fracture length and asymmetry, the model reproduces the variability seen in the measured data. For example, some stages may have a longer or shorter fracture length than predicted by the global length-volume relationship (light green dots, left graphic in Figure 3), but the well-level average fracture length will honor the global relationship (dark green dot, left graphic in Figure 3).
Similarly, some stages may have higher or lower morphology than predicted by the average morphology curve (light red dots, right graphic in Figure 3), but the well-level average morphology will honor the global morphology curve (dark red dots, right graphic in Figure 3).
Early versions of the fast frac model are being evaluated, and work is underway to link the frac model to fast production forecasting models.
Economic Considerations
AIF has vast potential, but it will require a significant commitment from operators and service companies to realize this vision, which presents the perennial question: Is the expected value worth the investment?
Since one of AIF’s primary benefits is improving proppant distribution, we may answer that question by estimating how much AIF will improve proppant distribution, using measurements from distributed acoustic sensing to calculate how evenly proppant was distributed during past completions, and correlating such uniformity with production. However, in the Bakken, the area of interest, there are too few DAS-based uniformity measurements to develop a reliable statistical relationship between uniformity and productivity.
Instead, Hess and ResFrac forecast the impact of more even fluid distribution by conducting two modeling studies. The first study uses a fully coupled hydraulic fracture-reservoir simulation model, and the second uses a simple fracture-reservoir simulation model. We will describe those studies in detail in September, but the results are encouraging.
In the most favorable scenario, when uniformity goes from poor to perfect, the models suggest AIF can increase production as much as 20%. In practice, the increase will be more modest because many stages already have decent fluid distribution and practical constraints make perfectly even distribution unobtainable. However, even under more realistic scenarios, such as ones where distribution goes from decent to great, the models point to material increases in production and net present value.
Editor’s Note: The preceding article is the first in a two-part series that concluded in AOGR’s September issue. The article is adapted from URTeC 4044071, a technical paper presented at the 2024 Unconventional Resources Technology Conference, held June 17-19 in Houston. The authors acknowledge the contributions of the paper’s co-authors: Hess Corp.’s Michael McKimmy and John Lassek, and ResFrac Corp.’s Ankush Singh.
CRAIG CIPOLLA is a principal completions engineering adviser at Hess Corp. He joined Hess in 2012 after serving as chief engineering adviser for hydraulic fracture monitoring and optimization at Schlumberger, vice president of stimulation technology at CARBO Ceramics and vice president of engineering at Pinnacle Technologies. He is a former Society of Petroleum Engineers distinguished lecturer on hydraulic fracturing. Cipolla holds a B.S. in engineering and a B.A. in chemistry from the University of Nevada-Las Vegas, and an M.S. in petroleum engineering from the University of Houston.
MARK MCCLURE is co-founder and chief executive officer of ResFrac. Before founding ResFrac in 2015, McClure was an assistant professor at the University of Texas at Austin in the department of petroleum and geosystems engineering. He serves on several scientific and academic boards and committees, and as an adjunct professor at Stanford University. McClure holds a B.S. in chemical engineering, an M.S. in petroleum engineering, and a Ph.D. in energy resources engineering from Stanford.
For other great articles about exploration, drilling, completions and production, subscribe to The American Oil & Gas Reporter and bookmark www.aogr.com.
