BHP Data Optimize Wolfcamp Wells
By Kyle D. Scott, Wei-Chun Chu and Raymond W. Flumerfelt
IRVING, TX–The Spraberry/Wolfcamp intervals in the Midland Basin are estimated to hold 75 billion barrels of oil-equivalent resource potential, easily making the Spraberry/Wolfcamp the largest oil field in the United States and the second-largest oil field in the world. However, the Wolfcamp Shale is still very early in the horizontal well development phase, and the play presents unique technical challenges.
First, the Wolfcamp has the largest vertical interval of any active U.S. shale play (thickness can exceed 2,500 feet), which requires multiple stacked laterals to fully develop. This presents considerable challenges in determining an optimal spacing and stacking development strategy.
Second, multiphase flow complicates reservoir engineering analyses by limiting the ability to accurately predict bottom-hole pressures from surface pressures and flow rates.
Finally, many Wolfcamp wells require artificial lift very early in their producing lives, and the efficiency of horizontal well artificial lift techniques to draw down BHP must be accounted for in well performance analysis.
To help address these issues and improve the profitability of field development and operations, Pioneer Natural Resources Company has run more than 100 BHP gauges with real-time monitoring in Wolfcamp horizontal wells. Although real-time BHP gauges have not yet been adopted widely in the onshore U.S. shale environment, the information has yielded value far beyond the cost of obtaining the data, and likely has application in other onshore shale plays.
Specifically, combining real-time BHP with other subsurface data is allowing Pioneer to evaluate interference between horizontal wells, quantify the variability of depletion vertically in stacked-pay intervals, develop flowback strategies, optimize artificial lift, and characterize the fracture system within the reservoir.
Real-Time BHP Data
Bottom-hole pressure can be calculated using surface pressure and flow rates combined with correlations, mechanistic models or artificial neural networks, but these methods lack the necessary accuracy and data frequency required to effectively understand well performance and impact important development decisions in the Wolfcamp Shale. Multiphase flow effects are the primary reason for the inadequacy of the calculated BHP method.
Wolfcamp horizontals produce three phases (oil, gas and water) from nearly the first day of production. These ever-changing pressures and flow regimes of the multiphase fluid column in the vertical portion of the wellbore drastically reduce the operator’s ability to calculate BHP accurately.
The secondary reason for the inadequacy of calculated BHP is lack of data frequency. Typically, surface pressures are recorded daily, rounded to the nearest 10 or 50 psi, and are either a 24-hour average or an instantaneous reading. That level of accuracy and data frequency will not suffice for the type of analyses being performed in the Wolfcamp. Calculated daily BHP averages may be in the ballpark and suffice for “quick and dirty” production analyses, but the detailed character seen in measured BHP data can be almost completely lost in calculated daily values during phases that can provide the most insight, such as during initial drawdown, compressor downtime, extended pressure buildups, and offset frac hits.
Obviously, more accurate and higher-frequency surface gauges can resolve this, but the primary multiphase flow issue remains. Both of these issues exist in a naturally flowing well, which is the most stable flowing condition. But once artificial lift is introduced, these issues are amplified. Artificial lift also brings downtime and periods of lift system optimization, both of which introduce new rate and pressure fluctuations into the once-stable flowing well.
For example, gas-lift wells bring new challenges to calculating BHP as a result of compressor downtime, variations in gas injection rates, fluid column changes in the annulus impacting gas injection depth, and improperly functioning injection valves. Gauges set below these continuously changing flowing conditions in the wellbore have significantly less noise, leading to better reservoir performance interpretations.
Application Examples
The examples presented in this article, which include horizontal wells flowing naturally as well as utilizing gas lift or electronic submersible pumps, show improved analysis methods made possible by using measured BHP. Although only pressure data are shown, temperature data from these gauges complement the analysis by providing another data type to educate the operator on the likely source and mechanism of observed pressure responses.
For wells using ESPs, the method for measuring BHP is simple. ESP systems typically measure and record downhole pump intake pressure, easily satisfying the engineer’s desire for accurate and high-frequency BHP data.
For gas-lift wells, measuring real-time BHP is more complex, and requires installing a gauge and a method for transmitting data to the surface. Gas-lift wells in this study incorporate a unique system where a gauge installed at the end of the tubing string measures tubing pressure while a tubing-encapsulated conductor (TEC) line is run from the gauge up the annulus to surface. The TEC line is run through the wellhead and connects to a surface box, which records high-frequency pressure/temperature data and transmits them to engineering offices daily or on-demand.
The real-time nature of these data makes them extremely valuable for optimizing and trouble-shooting the gas-lift system. These retrievable gauge assemblies can be used for the life of a gas-lift system and reused on subsequent wells.
Optimizing Well Performance
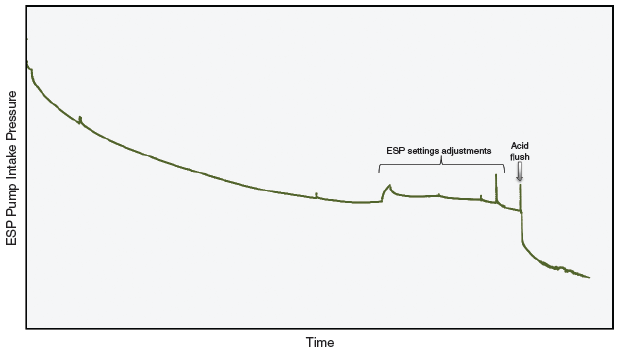
Figure 1A shows how measured BHP data were used to troubleshoot a potential artificial lift issue on an ESP well. Pump intake pressure revealed that the ESP was unable to adequately draw down the well, as seen in the flattening of BHP at an unacceptably high pressure.
After attempts to improve drawdown by adjusting ESP settings were unsuccessful, an acid flush was performed, resulting in increased drawdown. Production tests performed during the week before and the week after the acid flush revealed average rate increases from 460 to 1,125 barrels of fluid per day.
Without measured BHP, the initial production underperformance may have been interpreted simply as a bad well. With downhole pressure data, the problem was easily identified and fixed, resulting in greatly improved well performance.
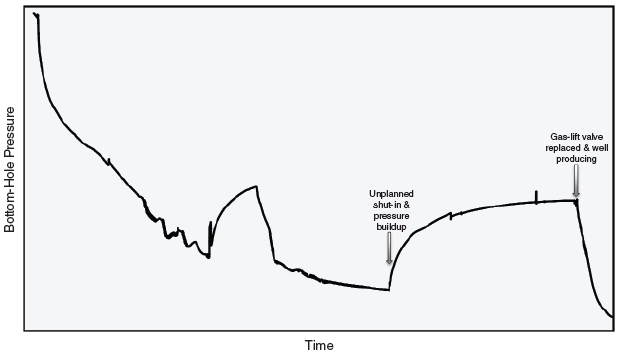
It is common practice in the Wolfcamp Shale to test wells on a periodic basis after initial flowback, which helps reduce capital associated with installing production trains for each well. Figure 1B shows how measured BHP was used as a surveillance tool in the absence of daily production tests and identified artificial lift issues on a gas-lift well. In this case, wells were being tested on a monthly basis, and the well in question was assumed to be producing normally when the BHP started building, which is indicative of the well not flowing or flowing at a significantly reduced rate.
A subsequent production test revealed the fluid rate had dropped from 430 to eight bbl/d. Casing pressure, gas-lift injection rate, and standard surface diagnostics suggested gas was injecting successfully into the bottom gas-lift valve and the well was fine.
Bottom-hole pressure, as a unique diagnostic measurement, was the only reason to pull equipment out of the well and search for an issue. After pulling the tubing, a shallow gas-lift injection valve failure was discovered. The valve was replaced and the well was reopened, producing an average 800 bbl/d of fluids during the first week.
These examples are only two of many instances where real-time BHP monitoring has allowed for rapid trouble-shooting and optimization of artificial lift systems in Wolfcamp horizontals, some of which may never have been understood fully without pressure data. They show how the value of having the downhole gauges is far greater than the minor cost of deployment.
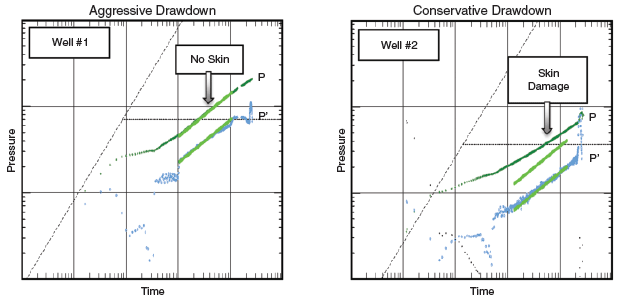
The example in Figure 2 shows how measured BHP can be used to identify root causes of well underperformance by analyzing pressure buildup during unexpected shut-ins associated with operational issues. The two gas-lifted horizontal wells had similar geology, drilling practices, landing intervals, and completion designs, but were flowed differently to test the impacts of managed drawdown.
Well No. 1 was flowed aggressively with no drawdown management, while well No. 2 was flowed conservatively through the extended use of chokes. Interestingly, the well with more drawdown not only had a higher rate, but also higher productivity, which was opposite of what had been observed in several other shale plays.
Because of operational issues, both wells were shut in and BHP was monitored during extended pressure buildups. Log-log plots of pressure and pressure derivative versus time revealed that well No. 2 (with managed drawdown) had interpreted skin damage, as indicated by the increased separation between the pressure and pressure derivative curves, compared with well No. 1.
While this was one of several key field trials that supported a flowback strategy decision for all future wells, it also demonstrated the applicability of using real-time BHP monitoring to identify near-wellbore damage during shut-ins.
Well Spacing And Stacking
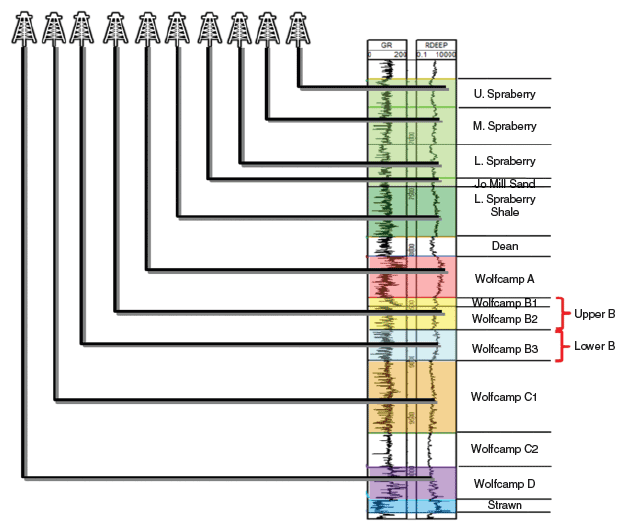
The Wolfcamp Shale, along with the overlying Spraberry, provides multiple stacked targets for developing horizontal wells. Introducing this third, vertical dimension increases the complexity and importance of determining optimal well spacing and understanding well-to-well interference and its impact on well performance.
Figure 3 shows a type log illustrating the number of potential targets that may exist at a single well location. With the statistical variability in well performance, it would take 50-100 wells to determine an optimal spacing and stacking strategy in a given area, based on well performance alone. Given the geomechanical variability throughout the field, these pilots would have to be repeated in multiple study areas, requiring hundreds to thousands of wells to fully optimize spacing and stacking across a large acreage position.
Getting up the learning curve quickly in regard to spacing and stacking has required analyzing and integrating multiple engineering and geoscience datasets, with interwell pressure interference at the top of the list.
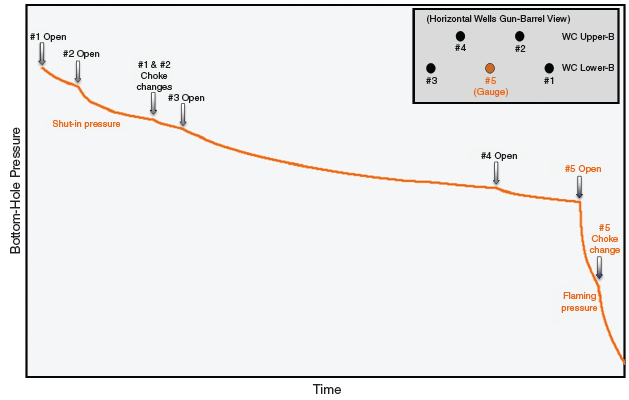
Figure 4A illustrates how measured BHP and interference tests can be used to quantify magnitude and direction of “time-zero” well connectivity (or the connectivity observed between wells during initial flowback). In this case, the shut-in BHP response from well No. 5 is shown as four surrounding wells are opened. Pressure begins to decline as soon as well No. 1 is opened, indicating connectivity with the offset well. The pressure decline steepens as well No. 2 is opened, again during well 1 and 2 choke changes, and again when wells 3 and 4 are opened.
This valuable data conclusively indicates that interwell connectivity exists simultaneously in each of four directions around the No. 5 well.
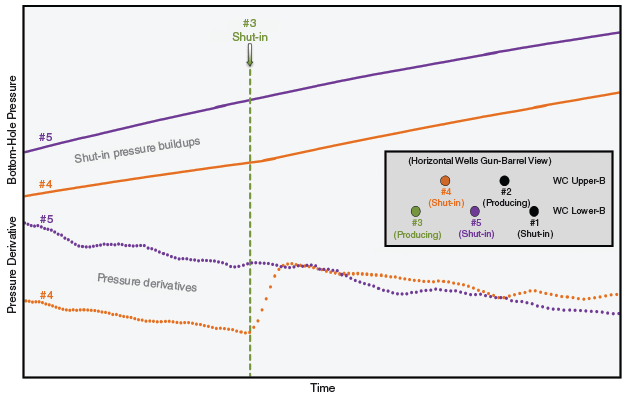
The observed time-zero connectivity may or may not degrade with time, as demonstrated in Figure 4B, using three wells from the example shown in Figure 4A. An additional interference test was conducted four months after time-zero connectivity was observed. Well Nos. 4 and 5 were shut in, BHP was monitored during pressure buildups, and surrounding wells were kept producing. After extended and stable pressure buildups were observed, well No. 3 was shut in also. Well 4 responded immediately with a more rapid pressure buildup and a step change increase in pressure derivative, indicating sustained connectivity with well 3.
However, well 5 did not respond to well 3 being shut in, indicating the time-zero connectivity observed between these two wells no longer existed. This leads to a key hypothesis that connectivity observed during initial flowback does not necessarily mean wells are spaced too closely because of the potential rapid degradation of the connected flow paths.
FIGURE 5
Directionality of Time-Zero Connectivity Among
Multiple Stacked Wells Using Shut-In Pressure Responses
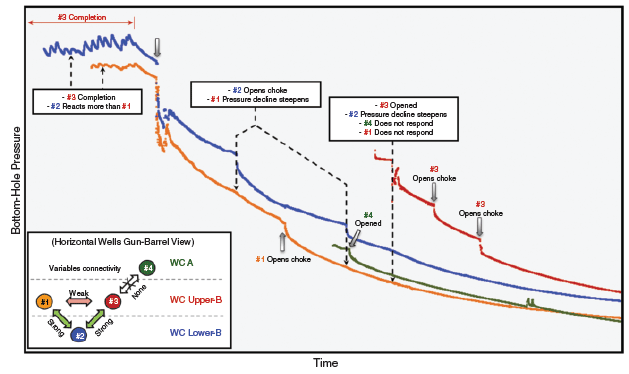
Figure 5 shows another time-zero interference test, but also includes interwell pressure interaction during completion, and adds a third stacked landing interval to the well configuration. Well 2 is landed in the Lower-B, wells 1 and 3 are in the Upper-B, and well 4 is in the Wolfcamp A. Wells 1 and 2 were completed first and had tubing and bottom-hole gauges installed in time to monitor shut-in pressure during a portion of well 3’s completion.
Interference between wells was observed clearly through changes in measured pressure trends associated with offset fracturing operations, placing offset wells on production, and in extreme cases by changing chokes on offset wells.
In this example, the observation is that the Upper-B and Lower-B have time-zero connectivity, but Upper-B and A do not complement our understanding of variable rock strength between these three landing targets and those rocks’ ability to act as frac barriers during completion.
Differences in these early responses provide insights to the shape and directionality of the induced fracture system, and can guide development optimization by making spacing, stacking and completion adjustments to wells with the strongest connectivity, especially if those interactions do not degrade adequately with time.
FIGURE 6
Insights on Horizontal Well Depletion with
Respect to Distance, Direction and Time using
Offset Vertical Well Shut-In Pressures
Horizontal Well Depletion
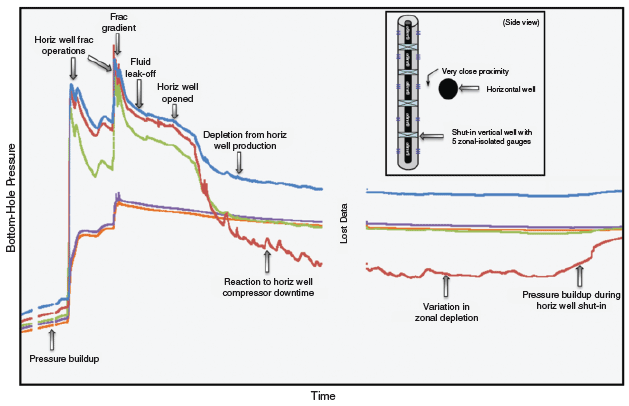
Figure 6 shows how a vertical well can be used to assist in understanding distance and directionality of horizontal well depletion. The vertical well in this example had been completed previously in multiple zones above, in and below the Wolfcamp, and had produced for 10 months.
A retrievable, multigauge assembly was installed in preparation for offset horizontal well activity. This assembly consisted of multiple downhole gauges isolated between packers for monitoring zonal shut-in pressure. A TEC line connected each gauge in series and ran up to surface, where real-time monitoring was recorded at a surface box.
One of the most important, yet difficult, challenges in optimizing well spacing and stacking is determining how much depletion is occurring a certain distance laterally and vertically away from a horizontal well. This multigauge assembly is designed to utilize vertical wells to quantify the shape and character of the depleting reservoir volume around a horizontal well.
The multigauge assembly was installed while an offset horizontal well was being drilled in very close proximity to the vertical well. The corresponding pressure buildup is shown in the bottom left of Figure 6.
Next, pressures from each gauge increased abruptly with varying degrees of intensity as a response to the horizontal well completion. There is a short period between completing and opening the horizontal well, and then pressure decline steepens when the horizontal well opens. Pressure continues to decline as the horizontal well produces.
The red pressure curve shows the most depletion and sustained connectivity with the horizontal well, followed by the green and blue pressure curves. The purple and orange pressure curves increase during the horizontal well completion, but have very little depletion response from horizontal well production. The minimal pressure decline of these two gauges may be dominated by leak-off of post-frac, supercharged pressure, or by minor communication with other gauges through a possible micro-annulus outside the vertical wellbore.
The varying degree of response among the five gauges provides drastically increased understanding of horizontal well depletion with respect to distance, direction and time–all of which improve the understanding of the fracture system feeding the well.
These pressure responses also provide some additional benefits. Pressure buildups prior to horizontal well completion provide valuable zonal-specific information that otherwise would be very costly and difficult to observe from a fully commingled vertical well. The pressure response peaks during horizontal well completion provide direct measurement of zonal frac gradients. Zonal fluid leak-off rate is measured directly in the period between horizontal well completion and production. The gauge with the strongest connectivity shows distinct responses to horizontal well compressor downtime, and provides pressure buildups for reservoir analysis during extended shut-ins.
Editor’s Note: The preceding article was adapted from URTeC 2154675, a technical paper presented at the 2015 Unconventional Resources Technology Conference, held July 20-22 in San Antonio. The authors acknowledge the numerous Pioneer Natural Resources colleagues who helped develop the work, and company management for its support.

Kyle D. Scott is a staff reservoir engineer on the Permian Basin asset team at Pioneer Natural Resources Company, where his recent focus has been on utilizing downhole pressure gauges to optimize well spacing and improve well performance analysis. Scott joined Pioneer in 2008. He has worked various assets focused on well spacing, performance analysis, rate transient analysis, reservoir simulation, and reserves and field development. He previously worked for four years designing the Joint Strike Fighter at Lockheed Martin. Scott holds a bachelor’s in aerospace engineering and a master’s in petroleum engineering from Texas A&M University.

Wei-Chun Chu is an engineering technical specialist on the Permian asset team at Pioneer Natural Resources. He has 35 years of experience in well testing, and pressure transient and production data analysis for conventional and unconventional reservoirs. Chu previously worked for OMV, Marathon Oil Company, and Johnston-Macco Flopetrol Schlumberger. He holds a B.S. in chemistry from New Mexico Tech and a Ph.D. in petroleum engineering from the University of Tulsa.

Raymond W. Flumerfelt is senior engineering manager on Pioneer Natural Resources’ Permian asset team, where he is focused on field development, production enhancement, well spacing, and completions optimization. During his 10 years at Pioneer, he has held a variety of positions, including senior staff engineer, manager of corporate engineering, and manager of corporate reservoir engineering. Prior to joining Pioneer, Flumerfelt held technical and leadership positions at Shell, S.A. Holditch & Associates, Cabot Oil & Gas and Matador Resources. He holds a bachelor’s and a master’s in petroleum engineering from Texas A&M University.
For other great articles about exploration, drilling, completions and production, subscribe to The American Oil & Gas Reporter and bookmark www.aogr.com.


