Market Outlook
Fuel Stocks Ready For Winter Demand
WASHINGTON–The U.S Energy Information Administration estimates that year-to-year marketed U.S. natural gas production is down in 2016 for the first time since 2005, averaging 77.3 billion cubic feet a day, or 1.4 Bcf/d less than in 2015. However, EIA says it expects 2017 production to expand by 2.9 Bcf/d to average 80.2 Bcf/d as a result of demand growth, stronger commodity prices, increased drilling, and infrastructure build-out to connect production to demand centers.
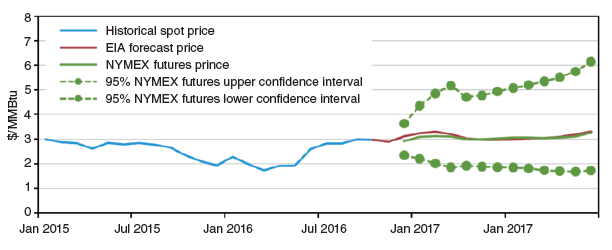
According to the agency, growing domestic consumption, higher pipeline exports to Mexico and increasing liquefied natural gas exports to overseas markets will help boost Henry Hub spot prices from a 2016 average of $2.50 an MMBtu to $3.12/MMBtu in 2017, with the high end of the forecast at $4.84/MMBtu. Figure 1 shows actual and projected Henry Hub prices from January 2015 through July 2017. The confidence intervals are derived from options market information for the five trading days ending Nov. 3.
FIGURE 1
Historical and Projected Henry Hub Natural Gas Prices
Note: Confidence intervals based on options market for five trading days ending Nov.3.
Source: All figures courtesy of U.S. Energy Information Administration
Looking at the upcoming winter, the National Oceanic and Atmospheric Administration is forecasting a return to close-to-normal temperatures. NOAA’s national forecast calls for much colder temperatures than last winter, when an El Niño weather pattern warmed temperatures 15 percent above the 10-year national average. On a regional basis, NOAA says it anticipates much colder temperatures than last winter east of the Rocky Mountains, with the Northeast and Midwest 17 percent colder, and the South 18 percent colder. In the West, forecast temperatures are similar to last winter.
Even with the long-range forecast calling for cold, EIA points out that autumn brought unusually warm temperatures, putting downward pressure on gas demand through mid-November. In fact, heating degree days in October were 38 percent below the 10-year average. However, reduced fall demand did not translate into additional storage builds in working natural gas inventories, which were already at historic levels. In fact, the pace of October injections slipped 8 Bcf/d compared with previous years, which EIA says could reflect a decline in natural gas production during October.
“EIA is forecasting 21 percent of U.S. natural gas consumption in December, January and February will be drawn from inventories, slightly higher than the five-year average,” EIA explains. “Rather than signaling the need for inventory builds to meet winter heating needs, the higher November-to-January futures price spread this year likely reflects the difference between warmer-than-normal fall temperatures and expectations for colder temperatures this winter compared with last winter.”
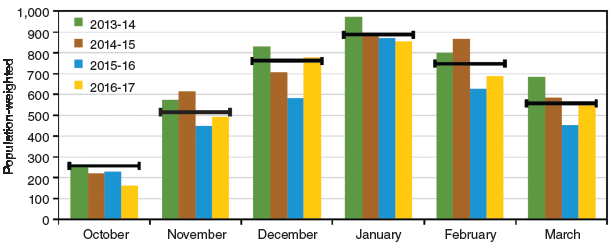
FIGURE 2
Historical and Projected Winter Heating Degree Days
Note: EIA calculations based on NOAA’s 14-16 month outlook. Horizontal lines = 10-year average.
Natural Gas
Figure 2 shows projected winter 2016-17 heating degree days based on NOAA forecast data and referenced to recent heating seasons. The horizontal lines indicate each month’s prior 10-year average. With nearly half of all U.S. households heated primarily with natural gas, EIA’s Winter Fuels Outlook predicts that residential gas prices will average 11 percent more than last winter at $10.37 an Mcf, which would be the highest since the winter of 2010-11.
Consumption is forecast to be 10 percent higher than last winter, given a return to more normal temperatures, and EIA says it expects Henry Hub spot prices to average $3.26 an Mcf, which would be 53 percent higher than last winter. Should actual winter temperatures turn out 10 percent colder that NOAA’s forecast, EIA says consumption and prices would be 19 percent and 10 percent higher than last winter, respectively.
On Nov. 11, EIA estimated working gas in storage at an all-time high of 4.047 trillion cubic feet. Stocks were 51 Bcf higher than at the same time in 2015, and 216 Bcf above the five-year average of 3.831 Tcf. Last winter’s warm weather left natural gas inventories at record highs at the start of the refill season in April. Partly as a result of record summertime natural gas consumption in power generation, storage injections for most weeks last summer were lower than the five-year average. Under the base case winter forecast, EIA says it expects inventories to end the winter at 1.9 Tcf.
In the event of a colder-than-forecast winter, high stock levels should help moderate price volatility, EIA notes. Although pipeline transportation constraints have eased somewhat in recent years, the agency says they remain a challenge to markets in the Northeast. Basis differentials last winter to the benchmark Henry Hub price in major Northeast demand centers were lower compared with the winter of 2014-15, as mild temperatures and some pipeline capacity additions in the Middle Atlantic region helped limit spikes, according to EIA.
This year, additional capacity will be available to deliver natural gas from the Marcellus region to New England with the startup of the Algonquin Incremental Market project. This incremental pipeline capacity has helped lower expected prices for natural gas delivered to Boston during the peak winter months by about $1/MMBtu compared with expectations from a year ago.
However, EIA notes that the Northeast still faces pipeline constraints, particularly in the New England market, contributing to significant basis differentials to Henry Hub futures. These constraints could contribute to day-to-day price volatility during periods of cold temperatures, the agency warns.
Propane
Propane is the primary heating source for 5 percent of U.S. households. U.S. propane inventories were at record levels going into the heating season, reaching 104 million barrels at the end of September, 4 percent higher than at the same time in 2015. EIA says it expects an inventory draw of 40.6 million barrels this winter, compared with 33.8 million barrels last winter. The projected draw still would leave inventories 32 percent above the five-year average at the end of the heating season.
With the colder weather, EIA predicts propane consumption in both the Midwest and Northeast markets will be 13 percent higher than last winter, and projects that prices will be 14 percent higher in the Midwest and 7 percent higher in the Northeast.
High inventories should be sufficient to allow for even stronger-than-projected inventory draws, given colder weather, higher crop-drying use, or stronger exports. With the addition of new export facilities during the past several years, and a new Gulf Coast terminal expected to begin operations later this month, EIA says the United States has the capacity to support higher-than-forecast levels of propane exports when spot shipments are economically viable.
Heating Oil
Nationwide, 5 percent of households use heating oil as the primary fuel, with the vast majority of them located in the Northeast, where 22 percent of all households rely on heating oil. EIA says it expects heating oil prices to be higher than last winter, given that crude oil prices are forecast to rise 24 percent with gradually tightening global supply balances.
Under the base case, EIA estimates that households using heating oil will spend 38 percent more than last winter, reflecting higher consumption and retail prices. In a 10 percent-colder weather scenario, consumption would be 25 percent higher than the base case and prices would increase another 24 percent.
Although forecast to be higher than last winter, EIA says crude prices should remain well below the levels seen from 2010 to 2014 as the global market continues to move toward balance. “However, crude oil prices remain highly uncertain, and any deviation in prices from forecast levels would cause a similar deviation in retail heating oil prices and consumer expenditures,” the agency reminds, while noting that high heating oil inventories in the Northeast region should limit price volatility, even in the event of colder-than expected temperatures.
Relatively high refinery output of distillate fuel, combined with last winter’s near-record warmth, resulted in distillate stocks totaling 52.3 million barrels in the Northeast at the end of September, which was nearly 7 million barrels higher than in September 2015, EIA reports.
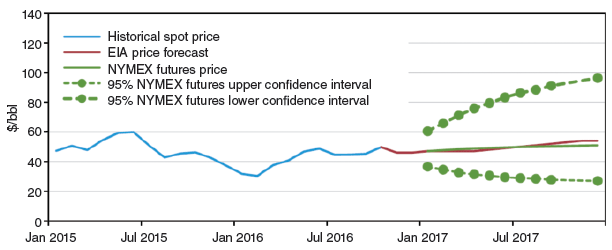
Looking at the larger U.S. oil market picture, EIA’s analysis forecasts West Texas Intermediate prices averaging $50/bbl in 2017. Figure 3 shows actual and projected WTI prices from January 2015 through July 2017, with confidence intervals derived from options market data for the five trading days ending Nov. 3.
FIGURE 3
Historical and Projected WTI Crude Oil Prices
Note: Confidence intervals based on options market for five trading days ending Nov.3.
EIA says total domestic output fell 600,000 bbl/d in 2016 to an average 8.8 million barrels a day, and projects that production will average 8.7 MMbbl/d in 2017. New production from increased drilling in the Permian Basin–the only region with growing production in October and November–is expected to partially offset declines in other lower-48 regions in 2017, according to the agency.
Total U.S. oil inventories are expected to decline through the first quarter of 2017, but global inventory is forecast to build through the first half of the year. Higher near-term prices reflected a counter-seasonal decline in total U.S. oil inventories and a decline in inventories at Cushing, Ok., in September and October, EIA reports.
“October refinery runs were 265,000 bbl/d higher than the five-year average in the Midwest, contributing to comparatively large inventory draws in the region,” EIA states. “In October, Midwest crude oil inventories outside Cushing dipped below year-ago levels for the first time since August 2014, likely providing support to near-term WTI prices.”
However, EIA reported large U.S. inventory builds in the last week of October and again in early November, including increased imports into the United States. “These movements could signal a rebalancing between domestic and international markets in the near future,” the agency suggests.
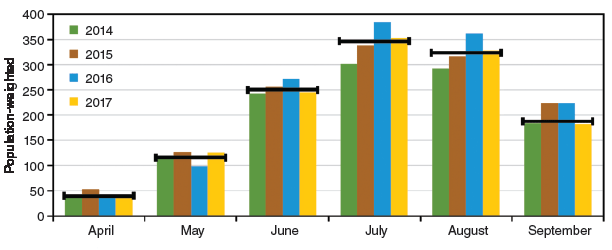
FIGURE 4
Historical and Projected Summer Cooling Degree Days
Note: EIA calculations based on NOAA’s 14-16 month outlook. Horizontal lines = 10-year average.
Electricity
Among U.S. households, 39 percent rely on electricity as the primary heating source, including 63 percent of all households in the South. EIA notes that power generation fueled by natural gas reached record levels last summer, and for the first six months of 2016, natural gas supplied 36 percent of total U.S. electricity generation versus 31 percent for coal. Figure 4 shows projected summer 2017 cooling degree days based on NOAA forecast data. The horizontal lines again indicate each month’s prior 10-year average.
However, with higher forecast natural gas prices, EIA foresees the share of generation from natural gas experiencing year-over-year declines. Based on expected temperatures and market conditions, EIA says coal will surpass natural gas in electricity generation in the heart of the winter heating months of December, January and February. For full-year 2017, the agency anticipates natural gas accounting for 33 percent of total electricity generation.
EIA data indicate that the generation cost of natural gas averaged $21.30 per megawatt-hour in August, nearly identical to the cost of coal. However, it says the cost of natural gas delivered to electric generators, including both spot market and contract purchases, generally has been increasing, and the agency says it expects average natural gas generation cost to reach a seasonal peak of $31 per megawatt-hour in February. That would be about 40 percent higher than the projected cost of coal on a national average basis.
“The higher relative costs of natural gas are likely to encourage the industry to use more coal to fuel electricity generation,” EIA says. “Forecast colder winter temperatures, especially in areas where coal is dominant, also contribute to higher projected coal use in power generation.”
EIA notes that natural gas now supplies 50 percent of New England’s total regional power generation, and that the increased reliance can put fuel supplies in competition with natural gas used for space heating during cold spells. Consequently, New England winter-time electricity prices on the wholesale market generally have tended to be higher than at other times of the year, with occasional price spikes.
For other great articles about exploration, drilling, completions and production, subscribe to The American Oil & Gas Reporter and bookmark www.aogr.com.


