Tapping Stacked Plays
Approach Optimizes Midland Basin Development
By Farhan Alimahomed, Raj Malpani, Rohann Jose, and Elia Haddad
HOUSTON–The Midland Basin is seeing an unprecedented boom in pad drilling driven by stacked pays in the Spraberry and Wolfcamp formations. Operators are targeting up to four reservoirs in one section using a “wine rack” pattern, which is the future of pad drilling. They also are increasing lateral lengths to up to two miles and pumping in excess of 2,000 pounds of proppant and 60 barrels of fluid per lateral foot, and perforation cluster spacing also has decreased to as low as 20 feet.
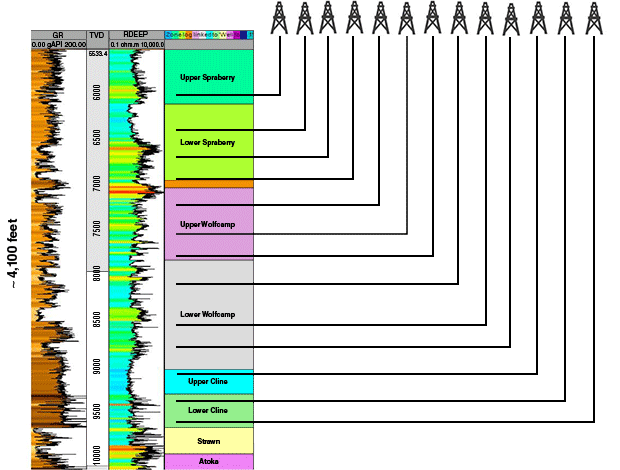
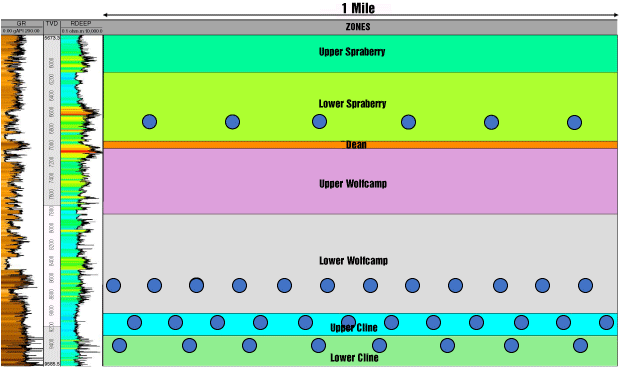
The Midland Basin consists of a 2,500- to 4,500-foot thick section that includes the Spraberry, Wolfcamp and Cline formations. A typical log profile of the entire play, as well as potential targets, is shown in Figure 1.
Technology integration plays a significant role in identifying the key drivers of production and optimizing well performance. Integrated workflows are being used in the Midland Basin to help operators better understand the growth of the hydraulic fractures and their production interference with offset wells. These workflows are centered on building a calibrated 3-D model to perform predictive modeling on various combinations of stacked laterals and determine the optimum vertical and lateral spacing.
The workflow involves building a geomodel using high-tier pilot well logs and utilizing an unconventional fracture model (UFM) to simulate hydraulic fractures to understand the overall fracture “footprint.” The fractures are then gridded in an unstructured manner and fed to a numerical reservoir simulator to perform production history matching. This is the most crucial step in the process because the calibrated model is then used for predictive modeling of the various combinations of lateral spacing/stacking.
This modeling approach can be applied to any dataset within the basin to determine the optimum landing location based on changing reservoir properties. It acts as an alternative approach to field testing varying spacing combinations, which could be both expensive and time consuming.
Modeling Approach
Pilot well logs represent one data point in the subsurface, but when coupled with seismic data, they can serve to build a detailed geological model. In the absence of seismic data, high-tier log data from wireline tools such as triple combo, advanced dipole sonic, nuclear magnetic resonance (NMR), elemental spectroscopy and image logs can be used to construct a sector model.
Petrophysical properties such as porosity, permeability, water saturation and lithology can be obtained from the triple combo, NMR and elemental spectroscopy tool and geomechanical properties such as Poisson’s ratio, Young’s modulus, and minimum and maximum horizontal stress can be obtained from the advanced dipole sonic tool. Image logs are important to understand facies changes and natural fractures and their orientations.
Porosity, permeability and water saturation from the logging tools were calibrated to core data and the minimum horizontal stress was calculated using advanced dipole sonic measurements. Pore pressure is an important input in the calculation of the minimum horizontal stress, so obtaining a reasonable estimate of pore pressure is critical in fracture simulations. The image logs in the pilot well were processed for natural fractures, and rose diagrams for each zone were created to determine the orientation of the natural fractures.
Typical pump schedules for the zones of interest were selected based on current industry practices. Specifically, the cluster design and pump schedules for all zones in the study include:
- Five clusters per stage and 30-foot cluster spacing;
- 1,500 (Upper and Lower Spraberry) to 1,800 (Upper and Lower Wolfcamp and Cline) pounds of proppant per foot;
- 36 (Spraberry) to 45 (Wolfcamp and Cline) barrels of fluid per foot;
- Pump rates of 70 (Spraberry) to 80 (Wolfcamp and Cline) bbl/minute;
- 100-mesh 40/70 proppant in the Wolfcamp and Cline, with 30/50 added for the Spraberry; and
- Slickwater frac fluid in the Wolfcamp and Cline with a maximum concentration of 2 pounds of proppant added per gallon, and slickwater with linear gel additives in the Spraberry with a maximum concentration of 3 pounds of proppant added.
A fully 3-D planar fracture simulation software was used to perform fracture simulations and determine fracture height growth to understand the effects of the stress barriers and potential pinch points. The fracture geometries were gridded for numerical reservoir simulation to determine the zones that have the highest hydrocarbon production potential for a vertical well. UFM simulations were run along the lateral to determine complex fracture geometries in different reservoirs related to varying rock properties and natural fracture orientations. Production history matching was performed using a P50 type curve generated from public data for each reservoir using known reservoir fluid properties. This helps to calibrate the model and determine the drainage area for horizontal wells. The drainage area acts as a guide to understanding the effective fracture half-lengths and distance at which wells should be spaced.
Microseismic events are frequently observed over a larger area around the wellbore during the stimulation treatment, but the exact reservoir volume responsible for production can still be unclear. Integrating all available petrophysical and geomechanical data, and simulating the production using the latest fracturing and reservoir simulators, is critical to understanding the extent to which fractures are draining the reservoir.
Other diagnostic methods such as bottom-hole pressure (BHP) gauges, oil and water tracers, microseismic monitoring, etc., can help determine interference between wells during stimulation and production, which helps calibrate the simulation results.
Well Stacking Modeling
The pilot logs show considerable variation in properties such as porosity and stresses in the different zones. Based on good reservoir and completion data, 20 points were picked as potential landing locations: one in the Lower Cline, two in the Upper Cline, six each in the Lower and Upper Wolfcamp, three in the Lower Spraberry, and one in the Upper Spraberry.
FIGURE 3
Complex Fractures for all Four Targets
Created using UFM and Unstructured Gridding
for Numerical Reservoir Simulation
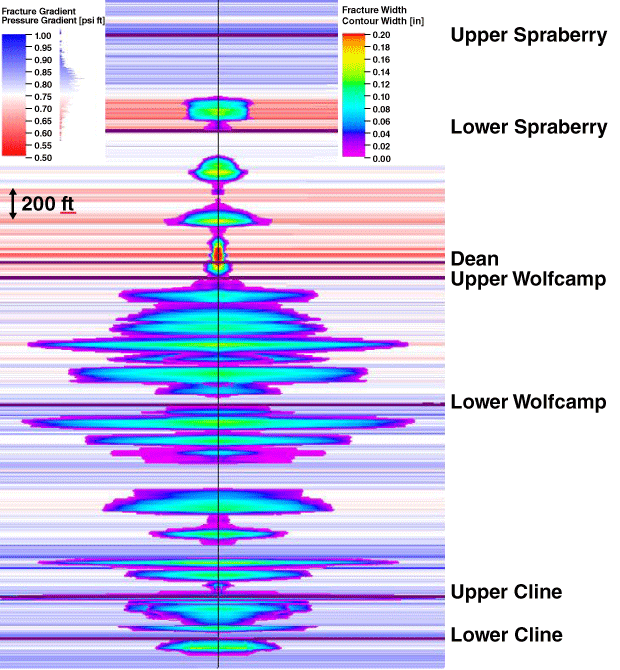
The pump schedules were scaled down to represent a single cluster, which is the best-case scenario assuming that the fluid is distributed equally through all clusters within a stage in a horizontal well. The fully 3-D planar fracturing simulator enabled us to finely grid the log data in a vertical direction to capture the small changes in properties that influence hydraulic fracture growth. Properties such as porosity, permeability and saturation dictate fracture fluid leak-off, while properties such as Young’s modulus and minimum horizontal stress determine fracture height, length and width.
Figure 2 shows the results of the planar 3-D simulations. The stress profile allows the majority of the hydraulic fractures to be isolated from the fractures above or below them, with only two landing points showing some overlap. These fractures were then gridded and input into the numerical reservoir simulator to gauge the production potential. Known pressure/volume/temperature (PVT) data and relative permeability curves for the Spraberry and the Wolfcamp formations were used and cross-checked with the literature.
A one-year forecast was performed to compare the potential of the individual targets to deliver hydrocarbons. No production history matching had been performed yet, so the forecasted production was still uncalibrated, but the process provided an idea of the zones with higher potential.
Four zones stood out in terms of higher oil production: the Lower Spraberry, Lower Wolfcamp (two targets), Upper Cline and Lower Cline. Fractures in all five targets are in isolation, so they were used as an input to the next step of determining optimal well spacing.
Well Spacing Modeling
Analysis of public sources of production data shows a good relationship between the barrels of oil equivalent and lateral length. To allow simulations to be done in a reasonable time and with efficient use of computing power, the fracture modeling and reservoir simulation on the horizontal well was performed over a normalized lateral length of 900 feet. The production data used for history matching also were normalized for a 900-foot lateral length to eliminate any bias due to stimulated lateral length.
The horizontal wells in each of the five targets comprised six frac stages with five clusters each, spaced 30 feet apart. The workflows for well stacking and spacing are considered for undeveloped acreage with undisturbed reservoir conditions. Several other studies describe the effects of depletion from offset wells on the completion and stimulation of new wells using software that allows for the integration of hydraulic fracturing, numerical reservoir simulation and finite element geomechanics.
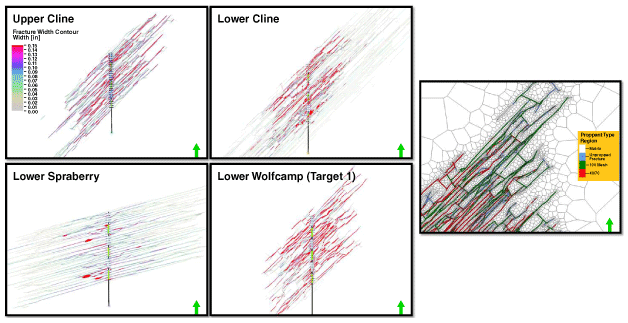
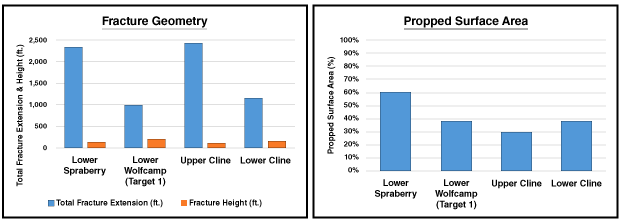
Fracture modeling was done using the UFM, which accounts for the interaction of the simulated hydraulic fracture with the natural fracture network. The fracture geometry comprises unpropped areas as well as propped areas, which need to be accounted for in the reservoir simulation. Figure 3 shows the resulting fracturing parameters from complex fracture modeling and the created hydraulic fracture geometry. UFM calculates a created fracture surface area during the simulation along with the area that is propped, depending on fluid and proppant transport models. Figure 4 clearly indicates that only a fraction of the total fracture area created is actually propped.
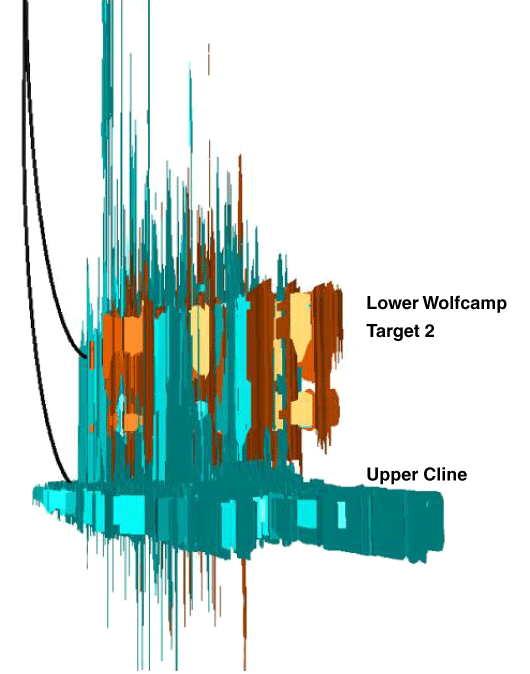
After a deeper look into the fracture geometries, the fractures from the Upper Cline were observed to overlap fractures from the second target in the Lower Wolfcamp (Figure 5). The increased height growth from the Upper Cline is caused by the increased “stress shadow” effect in a multicluster and multistage environment. We decided to move forward with the production history matching for four zones: Lower Spraberry, Lower Wolfcamp (target one), Upper Cline and Lower Cline.
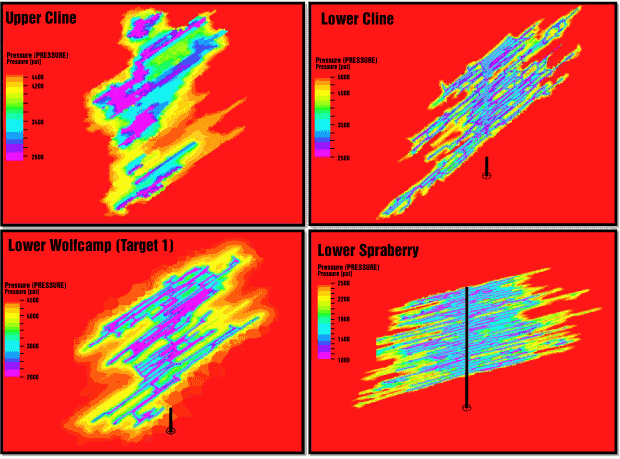
The fracture geometry is finely gridded in an unstructured manner closer to the fractures to account for the changes in proppant distribution within the fractures, and more coarsely gridded away from the fractures. Five years of production history matching were performed on all wells using P50 production from actual wells in the area. This allowed the model to be constrained and made for reliable forward modeling. The depletion profiles after five years of production show that the Lower Spraberry drains the furthest, while the Lower Wolfcamp and Upper Cline targets show limited drainage depending on fracture length (Figure 6).
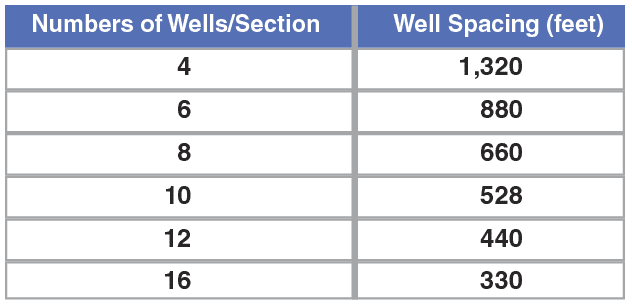
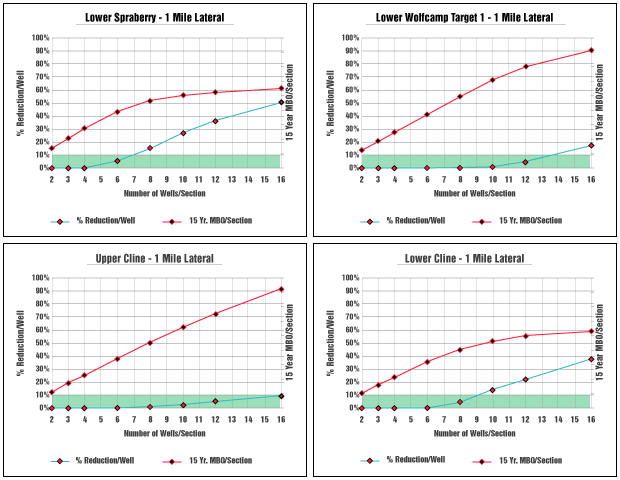
To determine the optimum well spacing, the model was constrained at various distances away from the wellbore. Table 1 shows the number of wells per section for those constraints. By applying the spacing constraints to the model, 15-year forecasts with a BHP limit of 750 psi were run (Figure 7).
The production numbers also were normalized for one-mile laterals. The results show that for each target, the 15-year production per section increases as we add more wells, but after spacing a certain number of wells, per-well production begins to drop. To determine the optimum number of wells to space per target, a 5 percent reduction in production per well was assumed to be acceptable.
The operator performing the study should subject all the analysis presented in this article to further economic analysis. Zones such as the Spraberry and Wolfcamp, being shallower than the Cline, will have lower drilling costs associated with depth. The completion designs and artificial lift technique for each zone also may vary and impact the economics. Multiple factors could play a role in making a particular zone more favorable than another.
From the results shown in Figure 7, a conclusion could be drawn that the optimum number of wells per section for the Lower Spraberry is six, the Lower Wolfcamp (target one) is 12, the Upper Cline is 12, and the Lower Cline is eight. That gives 38 wells to stack and stagger in four zones in a single section. Figure 8 shows a gun-barrel view of the result of modeling 38 stacked and staggered wells in one section.
The calibration of the models in this paper will allow us to address other scenarios, such as stimulation sequencing, completion design optimization, the timing of completions based on offset well depletion, refracturing, etc., by integrating fracturing, reservoir and finite element modeling. This is particularly important, because there are various producing legacy wells in the Permian Basin that influence the productivity of new horizontal wells.
Editor’s Note: The authors acknowledge their Schlumberger colleagues Edgar V. Arteaga, Lance Smith and Shrutesh Lati for their input and assistance in developing the preceding article. This article was adapted from SPE 187496, which was presented at the SPE Liquids-Rich Basins Conference, held Sept. 13-14 in Midland, Tx.

Farhan Alimahomed is the regional domain technology manager for OneStim at Schlumberger, based in Calgary. He started his career at Schlumberger in 2013 as a field engineer for stimulation in West Texas, and has been part of the production technology group since July 2014. In his current role, Alimahomed’s focus is on integrating data from various domains such as geology, petrophysics, geomechanics, hydraulic fracturing and reservoir engineering for optimizing completion designs, well spacing and stacking, parent-child well modelling, and overall field development planning. Alimahomed holds a bachelor’s in mechanical engineering from the University of Mumbai and a master’s in petroleum engineering from Texas Tech University.

Raj Malpani is a petroleum engineering lead with Schlumberger Production Management in Houston. He has designed and evaluated numerous horizontal wells in multiple active and upcoming unconventional reservoirs over the past 10 years. Malpani’s current interests include hydraulic fracture treatment design and evaluation, production data analysis, reservoir simulation, field development planning, geomechanics, restimulation, shale multiwell pads, and weak interface modeling. He holds an M.S. in petroleum engineering from Texas A&M University.

Rohann Jose is a production engineer for Schlumberger Production Management in Houston. He has five years of industry experience with production and completion analysis in unconventional reservoirs. His focus in recent years has been evaluating opportunities for field development in unconventional plays for Schlumberger Production Management in North America. Jose holds an M.S. in petroleum engineering from the University of Oklahoma and a B.S. in petrochemical engineering from India.

Elia Haddad is a geology domain champion for Schlumberger North America in Houston. He has 17 years of experience in borehole geology, structural geology and sedimentology. Haddad started his Schlumberger career as a borehole geologist in Egypt. He has contributed to numerous field exploration development plans within major petroleum provinces in the Middle East (offshore Nile Delta) as well as in unconventional petroleum systems in North America. Haddad graduated from Helwan University in Egypt with a degree in geology.
For other great articles about exploration, drilling, completions and production, subscribe to The American Oil & Gas Reporter and bookmark www.aogr.com.


