Higher Heating Bills In Store For U.S. Households
WASHINGTON–As winter approaches, the U.S. Energy Information Administration’s annual report on winter fuels predicts that U.S. consumers will spend more to heat their homes this winter compared with the past several years because of both higher commodity prices and slightly colder temperatures across much of the country.
With retail energy prices already at multiyear highs both in the United States and around the world, the report forecasts that prices for all fuels will be higher than in recent winters, especially for natural gas, crude oil and petroleum products. In early October, West Texas Intermediate oil prices and Henry Hub spot gas prices were up 51% and 84%, respectively, compared with last winter’s average.
“We expect average retail prices this winter for propane to be about 49% higher and heating oil to be 33% higher than last winter,” the report reads, noting that 5% of U.S. households heat primarily with propane and another 4% use primarily heating oil.
For the nearly half of all U.S. households that heat primarily with natural gas, fuel costs are expected to be 30% higher on average than last winter. If November-to-March temperatures turn out to be 10% colder than the historic average, those households would spend 50% more this year. The 41% of households that heat primarily with electricity are expected to spend 6% more this winter (15% more in a colder-than-average winter scenario).
“Although we attribute price increases over the past year to several factors, the main reason wholesale prices of natural gas, crude oil and petroleum products have risen is that demand has increased faster than production. This dynamic has led to falling inventories in the case of crude oil and petroleum products, and inventories increasing by less during the summer than historical averages in the case of natural gas and propane,” EIA details.
Based on the National Oceanic & Atmospheric Administration’s most recent forecast, EIA says its price modeling assumes that temperatures this winter will be colder than last winter and more similar to the average winters of the previous 10 years. On average, it expects 3% more population-weighted heating degree days across the United States than last winter, and 1% more than the previous 10-winter average. Regionally, it forecasts that the Northeast, Midwest and West will have 3%-4% more HDDs this winter, with the number of HDDs in the South remaining about the same.
Demand, Price Expectations
According to EIA, U.S. residential heating demand is forecast to average 20.8 billion cubic feet a day this winter, with average household consumption to total 58 Mcf (up 2% from last winter). Residential natural gas prices will average $12.92/Mcf, up from an average of $10.17/Mcf last winter. “Given the increases in natural gas commodity prices over the past year, we expect consumers to experience larger increases in retail prices than they have in previous winters. If spot prices continue to rise, retail prices this winter could be even higher than our forecast,” EIA offers.
The largest winter-to-winter increase in residential natural gas prices is expected in the Midwest, where EIA forecasts 45% higher prices, followed by the South (22%), West (20%), and the Northeast (14%).
“We forecast Henry Hub benchmark spot prices to average $5.67/MMBtu, an 86% increase from last winter. A combination of flat U.S. production and record-high levels of liquefied natural gas exports have resulted in below-average storage levels and upward pressure on prices,” the report reads.
EIA estimates that U.S. dry gas production averaged 91.6 Bcf/d in the first half of 2021, an increase of only 0.1 Bcf/d from 2020’s daily production. LNG and pipeline exports averaged 18.0 Bcf/d in the first half of 2021, an increase of 3.7 Bcf/d from the same period in 2020. Most of the increase came from LNG exports, which EIA says are expected to exceed pipeline exports for the first time on an annual basis in 2021.
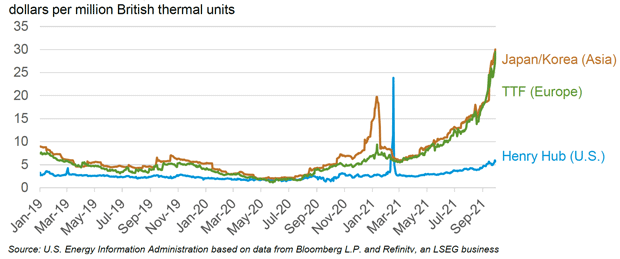
Despite strengthening U.S. natural gas prices, Henry Hub futures prices are still trading at steep discounts to prices in Asia and Europe (Figure 1). In September, the LNG spot price in Asia averaged $23.35/MMBtu, and the price at Europe’s TTF benchmark in the Netherlands averaged $23.02/MMBtu. That compares with an average Henry Hub spot price of $5.16/MMBtu. The price differential contributes to upward price pressure for U.S. natural gas and has led to record volumes of U.S. LNG exports to Asian and European destinations.
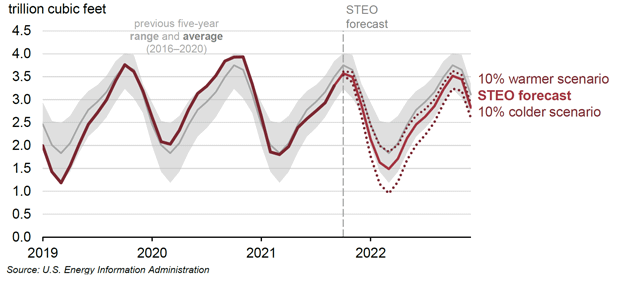
Working U.S. natural gas inventories are projected to reach 3.6 trillion cubic feet at the end of October, or 5% below the five-year average (Figure 2). Under the baseline temperature scenario for winter 2021-22, EIA expects inventory draws to outpace the five-year average, depleting U.S. stocks to below 1.5 Tcf by the end of March, which would be 12% below the five-year seasonal average. U.S. LNG exports are forecast to average a record 10.7 Bcf/d this winter, a 19% (1.7 Bcf/d) increase from last winter.
Should winter temperatures average 10% colder than forecast, natural gas inventories would end the heating season in March at less than 1.0 Tcf, or 44% below the five-year average, driving Henry Hub spot prices significantly higher than baseline forecast levels.
Gas-To-Oil Switching
The global LNG price rally is increasing the economic incentive to switch from natural gas to oil in power generation where feasible. Steep carbon regulations and operational constraints limit Europe’s ability to burn oil in power plants, but Asia has more flexibility, according to a report from Rystad Energy. If the gap between LNG and oil prices remains wide, Asia is set to boost oil demand by 400,000 bbl/d on average over the next two quarters, adding fundamental support to already strong global oil prices.
Asia’s liquid-burning capacity for power generation has declined over the past 10 years, but is still about 100 gigawatts, mostly in Japan, Taiwan, Indonesia, Bangladesh and Pakistan, according to Claudio Galimberti, senior vice president on Rystad Energy’s oil markets team.
Asia’s current oil consumption for power generation fluctuates at around 900,000 bbl/d, which leaves a monthly unused and available oil-burning capacity of 550,000 bbl/d. With the continent expected to add 400,000 bbl/d on average in the next six months, utilization of the oil-burning infrastructure will surge, the report says.
Of the 550,000 bbl/d potential uplift in demand, Japan would account for the lion’s share with more than 300,000 bbl/d, followed by Indonesia, Taiwan, Bangladesh and Pakistan, Galimberti relates. This assumes a load factor of 0.7 for all the liquid capacity, and also takes into account that some older natural gas plants can switch to oil temporarily.
“This is a significant increase for Asia, when looking at its current oil-to-power use. From a global oil balance perspective, this would be a significant shift, and it provides support to the current rally in oil prices,” Galimberti remarks.
Asian natural gas prices are forecast to hold well above $20/MMBtu over the coming winter, creating clear upside for oil demand in the region, unless oil prices increase even faster and cause the price spread to LNG to narrow, Galimberti says.
Liquid-burning power plant capacity is approximately 2.6% of the total installed capacity in Asia, but actual power generation coming from liquids is usually lower, he explains. Pure liquids plants typically have very low utilization factors, both for economic and environmental reasons. Overall liquids generation in Asia only accounted for around 1% of total power generation last year, down from around 3% a decade earlier.
For other great articles about exploration, drilling, completions and production, subscribe to The American Oil & Gas Reporter and bookmark www.aogr.com.


