Oil Markets
IEA, OPEC See Global Demand Recovery Underway
Demand for crude oil is on a path of recovery, according to the International Energy Agency. Consumption in the second half of the year is expected to average within 5.1 million barrels a day of 2019’s record level, and further improve to within 2.6 MMbbl/d of 2019’s average, with jet fuel and kerosene accounting for most of that deficit, the agency forecasts in its July Oil Market Report (OMR).
“New data confirm that the worst of the demand destruction was in the first half of the year. Demand fell by 16.4 MMbbl/d year-on-year in the second quarter as lockdowns were imposed to combat the COVID-19 pandemic,” the report states.
IEA projects oil demand will rebound by a total of 11.3 MMbbl/d in the third and fourth quarters for a full-year average of 92.1 MMbbl/d, down 7.9 MMbbl/d versus 2019. For 2021, demand will be 97.4 MMbbl/d. Increased demand in May was led by China and India, up 700,000 and 1.1 million bbl/d, respectively.
On the supply side, IEA pegs June global crude oil production nearly 14 MMbbl/d lower than it had been in April, when lockdowns began and OPEC and its allies called an end to a one month-long price war and instead united to reduce supply by 13%.
“Global oil supply fell by 2.4 MMbbl/d in June, to a nine-year low of 86.9 MMbbl/d. Robust compliance with the OPEC+ output deal and steep declines from other producers, led by the United States and Canada, has cut world oil output by nearly 14 mb/d since April,” the OMR states. “If the OPEC+ cuts stay in place as agreed, global supply could fall by 7.1 MMbbl/d in 2020 before seeing a modest recovery of 1.7 MMbbl/d next year.”
The report estimates that OPEC+ nations achieved 108% compliance in June, with Saudi Arabia cutting production by an additional 1 MMbbl/d. That put OPEC’s output at its lowest mark since the 1990s.
In the United States, the July OMR says oil production shrank by 1 million, 1.3 million and 500,000 barrels a day in April, May and June, respectively. The 2.8 MMbbl/d decline represented a 21.5% drop in U.S. output since the end of March.
“However, in the second half of the year, supply could start to grow,” the IEA report offers. “We see U.S. production bottoming out and then slowly growing and OPEC+ countries are set to ease their existing cut by around 2 MMbbl/d from August. Also, by the end of the year, Libya’s oil production could be as much as 0.9 MMbbl/d higher than it is today.”
Remarkably Stable
A recovery in economic activity is shown by various indicators, the OMR notes, but adds that growth in new COVID-19 cases in early summer casts a shadow over the outlook.
“Only time will tell if the economic impact will be serious,” IEA remarks in the report. “In the meantime, benchmark crude oil futures prices have been remarkably stable, with both Brent and West Texas Intermediate hovering around $40/barrel and the contango seen in both futures curves flattening. Futures markets are anticipating a transformation in the oil market from substantial surplus in the first half of the year to a deficit in the second half.”
OECD industry stocks rose by 2.64 MMbbl/d in May to 3.2 billion barrels. With ample stocks, product prices lagged crude, squeezing cracks and refinery margins. In China, refinery throughputs in June were estimated at a record 14 MMbbl/d. On average, however, the report forecasts that global refinery runs will fall by 6.4 MMbbl/d in 2020 before increasing by 4.7 MMbbl/d in 2021.
“In June, floating storage of crude oil decreased by 34.9 MMbbl from its all-time high in May to 176.4 MMbbl,” IEA points out, explaining that a tightening market balance and flatter forward price curves reduce the incentive to store oil and encourage stock draws.
For the week ending July 10, commercial crude oil inventories decreased by 7.5 million barrels from the previous week, with refineries operating at only 78.1% of capacity, according to the U.S. Energy Information Administration. For full-year 2020, EIA forecasts that U.S. crude production will average 11.6 MMbbl/d and natural gas production will average 96 billion cubic feet a day.
Market Rebalancing
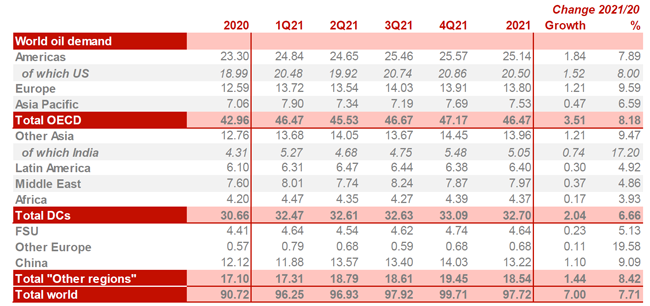
In its July oil markets report, OPEC says it expects strong demand recovery in the third and fourth quarters of this year to help propel demand to 99.71 MMbbl/d by the fourth quarter of 2021, which would be slightly higher than 2019’s full-year average consumption of 99.67 MMbbl/d.
FIGURE 1
2021 Projected World Oil Demand (MMbbl/d)
Note: 2020-2021 = Forecast. Totals may not add up due to independent rounding.
Source: OPEC
On an annualized basis, the organization estimates that total global oil demand will average 90.7 MMbbl/d in 2020, down 8.95 MMbbl/d from 2019, and then jump by 7 MMbbl/d in 2021 to average 97.72 MMbbl/d (Figure 1). It says it anticipates the call on OPEC production to average 29.8 MMbbl/d in 2021, slightly higher than the 29.34 MMbbl/d member nations supplied in 2019.
On a quarterly basis, OPEC projects that global demand will steadily climb from a low of 81.95 MMbbl/d in 2Q20 to 92.22 MMbbl/d in 3Q20, 96.22 MMbbl/d in 4Q20, 96.25 MMbbl/d in 1Q21, 96.93 MMbbl/d in 2Q21, 97.92 MMbbl/d in 3Q21, and 99.71 MMbbl/d in 4Q21.
Looking at U.S. production in April, the report notes that the offshore Gulf of Mexico and all states except Colorado recorded declines in oil output, with the steepest drops occurring in Texas and North Dakota–homes to the most productive tight oil plays.
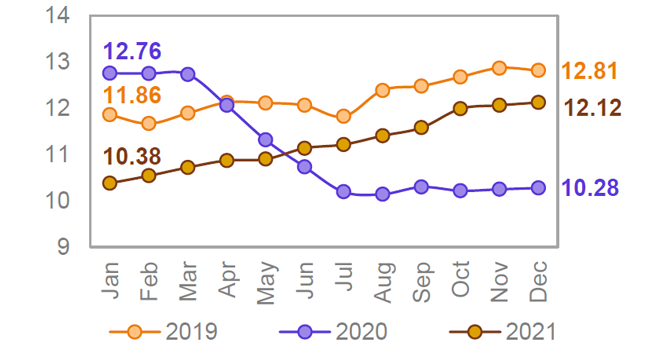
As shown in Figure 2, OPEC forecasts that total onshore U.S. production will bottom out at 10.21 MMbbl/d in 3Q20, before gradually increasing to 12.06 MMbbl/d in 4Q21 (4Q19 production was 12.78 MMbbl/d). Compared to 2019, it sees onshore tight crude production dropping by 810,000 bbl/d to average 6.88 MMbbl/d in in 2020, and onshore conventional production declining by 300,00 bbl/d.
Citing statistics from Rystad Energy, the report notes that 311 wells started producing in June in all U.S. shale basins–509 fewer than in June 2019–and only 198 horizontal wells were spudded and 140 were completed.
FIGURE 2
2020-21 Projected U.S. Crude Oil Production (MMbbl/d)
Note: 2020-2021 = Forecast.
Source: OPEC
“As the current decline in legacy tight crude output is steeper than that seen in 2015-16, any production recovery is not likely to be able to offset this trend in the near term,” the report reads. “Hence, tight crude production is expected to (fully) recover to pre-pandemic levels in 2022.”
The Permian Basin is the only tight oil region in which OPEC projects continuous year-over-year growth for both 2020 and 2021, with increases of 220,00 and 170,000 bbl/d, respectively. It forecasts production in the Bakken/Three Forks and Niobrara to resume growth in 2021, with output in the Eagle Ford and other tight oil plays remaining flat or slightly declining.
For other great articles about exploration, drilling, completions and production, subscribe to The American Oil & Gas Reporter and bookmark www.aogr.com.


