Natural Gas Outlook
EIA Projects Stronger Natural Gas Prices
HOUSTON–Natural gas-fired electricity generation first exceeded coal-fired generation on a monthly basis in April 2015, but natural gas was the primary fuel source for U.S. electricity generation for the first time on an annual basis in 2016, according to the U.S. Energy Information Administration.
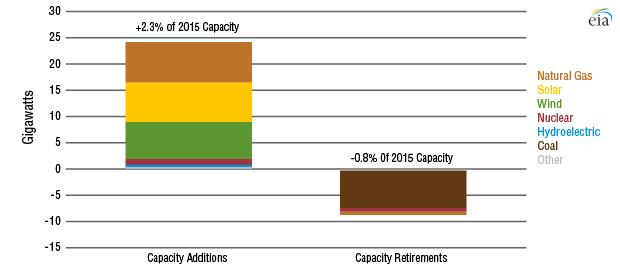
EIA says natural gas held the largest share of the power generation market in nearly every month last year, generating as much as 155 million megawatthours a month during peak summer demand. In total, natural gas accounted for a record 34 percent of total annual utility-scale power generation, compared with 30 percent for coal. The agency estimates that 24 gigawatts of utility-scale capacity was added in 2016, including new natural gas facilities (Figure 1), while 7 GW of coal-fired capacity was retired during the year.
More growth is in store for natural gas in the electricity market over the next two years, EIA reports, noting that utilities indicate they will increase natural gas-fired capacity by 11.2 GW in 2017 and another 25.4 GW in 2018.
“If these plants come online as planned, annual net additions in natural gas capacity would be at their highest levels since 2005,” EIA states in a Jan. 30 report. “On a combined basis, these 2017-18 additions would increase natural gas capacity by 8 percent from the capacity existing at the end of 2016. Depending on the timing and utilization of these plants, the new additions could help natural gas maintain its status as the primary energy source for power generation, even if natural gas prices rise moderately.”
Many of the natural gas-fired power plants under construction are located in Mid-Atlantic states and Texas to capitalize on expanded production from major shale plays. Ongoing natural gas pipeline and midstream infrastructure expansions also are supporting growth in natural gas-fired electric generating capacity, EIA states.
The continuing expansion of natural gas in the electricity sector is partly the result of the low cost of supplies from shale plays and partly in response to stricter environmental regulations. Regarding the latter, EIA says carbon dioxide emissions from the U.S. electric generation sector have been trending lower since 2007, in step with increasing consumption of natural gas. In fact, as the agency reveals in a Jan. 19 report, CO2 emissions from the power sector are now below transportation sector CO2 emissions for the first time since the late 1970s.
On average, EIA estimates that the combustion of natural gas emits 117 pounds of CO2 per MMBtu compared with 206-229 pounds per MMBtu for coal. Natural gas electric generators also tend to be more efficient than coal generators, because they require less fuel to generate electricity. Consequently, while natural gas accounted for 34 percent of total U.S. electricity generated in the 12 months from October 2015 through September 2016, it produced only 31 percent of the sector’s total CO2 emissions. In contrast, coal was responsible for 61 percent of the sector’s total CO2 emissions while fueling only 31 percent of the electricity generated during that period, according to the agency.
Prices Trending Up
While the cost of natural gas delivered to power generators declined from an average of $5.00 per MMBtu in 2014 to $3.23/MMBtu in 2015 and $2.78/MMBtu in the first 10 months of 2016, EIA’s January 2017 Short-Term Energy Outlook (STEO) projects increasing natural gas prices in both 2017 and 2018.
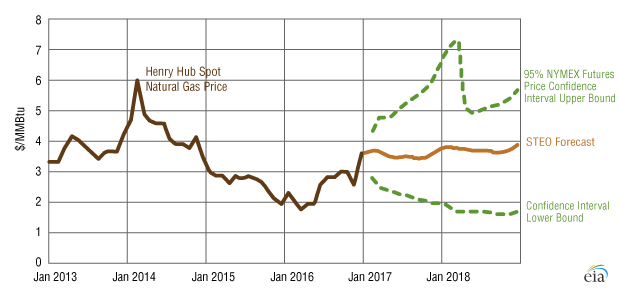
EIA says it expects the Henry Hub natural gas spot price to average $3.55/MMBtu in 2017 and $3.73/MMBtu in 2018 compared to the 2016 average of $2.51/MMBtu. “The higher Henry Hub prices reflect natural gas consumption and exports exceeding supply and imports, leading to lower average inventory levels,” the STEO states.
In 2016, Henry Hub natural gas prices averaged their lowest annual level since 1999 after an abnormally mild 2015-16 winter left storage at unprecedented highs last spring. However, EIA says record natural gas use for electricity generation during the summer and declining production contributed to Henry Hub natural gas prices rising from an average of $2.00/MMBtu in the first quarter of 2016 to above $3.00/MMBtu on a monthly basis for the first time in two years in December 2016.
For 2017, EIA forecasts that Henry Hub prices will remain near the December levels, when Henry Hub spot prices averaged $3.59/MMBtu. Prices are expected to move higher again in 2018 as a result of U.S. consumption and exports exceeding forecasted production and imports, with the difference supplied from storage inventories (Figure 2).
While stronger prices are obviously good news for natural gas producers, the agency says they could impact the gas-fired power plant additions planned for 2017-18, noting that construction timelines for new gas plants are relatively short. Higher prices also would encourage generators to diminish the utilization rates on gas-fired capacity already installed. Accordingly, the STEO projects that the share of total U.S. generation supplied by natural gas will slip from 34 percent in 2016 to 32 percent in 2017 while coal’s share rises from 30 to 32 percent.
By 2018, however, EIA says the scheduled expansion of overall capacity fueled by natural gas is expected to more than offset the effects of higher natural gas prices and any potential price-related utilization reduction, resulting in an increase in natural gas’s share of total U.S. electricity generation.
Consumption, Export Growth
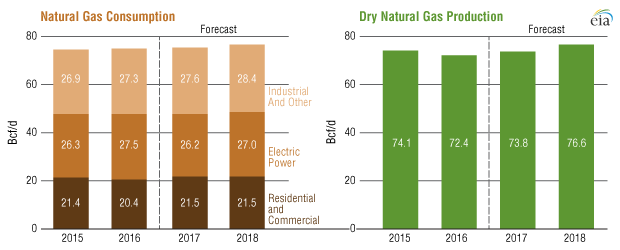
EIA expects total U.S. natural gas consumption to increase year-over-year in both 2017 and 2018, even with higher natural gas prices eroding some electricity sector demand in 2017. Natural gas-fired power generation is forecast to rise in 2018 given overall growth in electricity generation, but remain slightly below 2016’s record level (Figure 3).
After declining in 2016 for the first time since 2005, EIA says dry domestic natural gas production is forecast to increase in both 2017 and 2018. The return to a pattern of increasing production reflects the forecast for higher spot prices as well as pipeline infrastructure buildout, particularly in the Marcellus and Utica regions in Ohio and Pennsylvania.
Natural gas exports also are projected to increase, according to the January STEO. Export growth in 2017 largely reflects additional capacity coming online at Cheniere’s Sabine Pass liquefied natural gas liquefaction plant in Louisiana. Growth in 2018 is driven by the expected start of the Cove Point LNG plant in Maryland in late 2017 and new projects at Cameron LNG and Freeport LNG located in the Gulf Coast region during the second half of 2018. The agency says it also expects a small increase in pipeline exports to Mexico in both years.
Meanwhile, natural gas imports are expected to remain relatively stable at slightly more than 8 billion cubic feet a day. With forecasted growth in exports and flat import levels, EIA says the United States is on track to become a net exporter of natural gas on an annual basis in 2018.
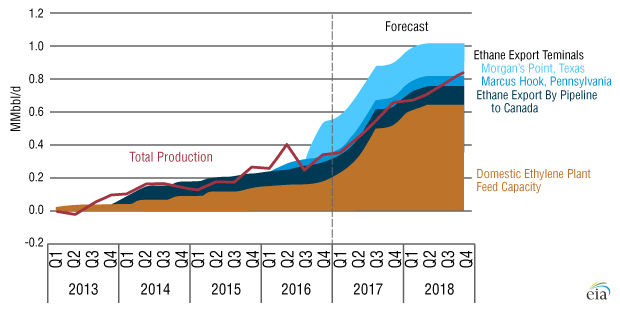
FIGURE 4
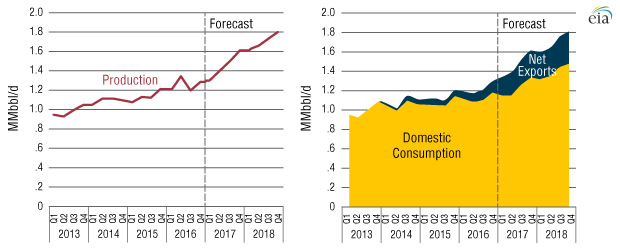
U.S. Quarterly Ethane Production, Consumption and Exports (2013-18)
Note: Total production includes both natural gas plant production and refinery and blender net production.
Higher Ethane Prices
Looking specifically at ethane, EIA says trends mirror the projected production, consumption and export growth patterns in the broader U.S. natural gas market. In a Jan. 17 report, the agency forecast U.S. ethane production to increase from 1.25 million barrels a day in 2016 to 1.7 million bbl/d in 2018, with growth in both domestic consumption and exports supporting higher prices and encouraging more ethane recovery from raw natural gas (Figure 4).
Expansions at existing domestic ethylene plants contributed to a 170,000 bbl/d increase in ethane consumption between 2013 and 2016 (Figure 5), EIA says. By mid-2018, construction is expected to be completed at six new ethylene plants and one restarted facility, collectively capable of using 450,000 bbl/d of ethane feedstock, the report finds. Most of these plants are designed specifically to use ethane without the ability to switch to other feedstocks.
Accordingly, EIA predicts U.S. ethane consumption will increase by 310,000 bbl/d (26 percent) between the first quarter of 2013 and the fourth quarter of 2018 as new and retooled plants ramp operations.
Ethane exports also are forecast to climb higher. Until December 2013, when the new Mariner West pipeline provided a route to the Canadian market by bringing Marcellus ethane from Pennsylvania through Ohio and Michigan to Ontario, Gulf Coast petrochemical plants were the only outlet for domestically produced ethane, according to EIA. However, the completion of the Vantage pipeline project to ship ethane to Canada, and construction of two marine export terminals allowed ethane exports to expand to an estimated 130,000 bbl/d by the fourth quarter of 2016, the agency reports.
The first U.S. ethane export terminal, located at Marcus Hook, Pa., with an export capacity of 35,000 bbl/d, shipped its first ethane cargo in March 2016. A second export terminal, located at Morgan’s Point, Tx., with a capacity of 200,000 bbl/d, shipped its first ethane cargo in September. EIA says the Morgan’s Point terminal is 90 percent contracted, and exports are ramping quickly. Although the first shipments from Morgan’s Point went to Europe, the facility sent shipments to India in December and January.
The shipments to India were transported on two new very large ethane carrier (VLEC) vessels: the Ethane Crystal and Ethane Emerald. The vessels each can hold up to three times more ethane than existing shipping vessels, and they are the first two of six VLECs commissioned by Reliance Industries to transport ethane from the U.S. Gulf Coast to petrochemical plants in India. EIA predicts U.S. ethane exports will increase by 180,000 bbl/d between the fourth quarters of 2016 and 2018 as the shipments ramp up.
For other great articles about exploration, drilling, completions and production, subscribe to The American Oil & Gas Reporter and bookmark www.aogr.com.


