Market Drivers
Natural Gas Setting Summer Demand Record
WASHINGTON–Demand for natural gas is expected to jump to historical highs this summer, according to the Natural Gas Supply Association.
Driven by increased consumption in electric generation, NGSA says combined demand from the electric, industrial, residential and commercial sectors is projected to average a record 69 billion cubic feet a day.
“When NGSA weighed the various factors, the picture that emerged for the upcoming summer was one of remarkable growth in demand,” says NGSA President Dena Wiggins. “We anticipate electric demand for natural gas to reach record levels this summer, topping last year’s record.”
While demand from the industrial sector is expected to increase only slightly, and residential and commercial demand is expected to hold steady from last summer, Wiggins reports the electric sector is forecasted to increase by 11 percent this summer compared with last summer. About 70 percent of the increased demand can be attributed to a permanent shift to natural gas-fired power generation caused by operators retiring large numbers of coal-fired power plants, she says, adding that the remainder of the increase in the electric sector is related to short-term coal-to-gas fuel switching.
According to Wiggins, 67 major natural gas-intensive industrial projects have been or will be completed between 2015 and 2020, representing $111 billion in investments, in addition to 39 projects representing another $17 billion that were completed between 2010 and 2014.
Despite the demand growth, however, pressure on seasonal natural gas prices is likely to be downward compared with summer 2015, considering all the supply and demand variables, Wiggins reports. Those factors include:
- A weather forecast that is 8 percent warmer than the 30-year average, but slightly cooler than last summer;
- A sluggish U.S. economy with minimal gross domestic product growth;
- Increasing exports to Mexico;
- More gas in storage at the start of the injection season than last summer; and
- Ample supply, with summertime U.S. production estimated to average 75 Bcf/d.
“The shale revolution has ushered in a remarkable era, as evidenced by dramatic growth in production over the past eight years,” Wiggins relates. “Despite fewer drilling rigs, this summer’s supply is expected to match last summer’s because of drilling efficiencies, new infrastructure coming on line to move natural gas out of producing shale areas, and the completion of many onshore and offshore wells.”
While global liquefied natural gas shipments are expected to become a significant component of U.S. natural gas exports in time, Wiggins notes that pipeline deliveries to Mexico account for the majority of U.S. export volumes. Given the completion of new pipeline projects on both sides of the border, which facilitate growing demand for gas-fired electricity and manufacturing in Mexico, she says exports are projected to increase to 4 Bcf/d this summer.
“The important take-away is the strength and responsiveness of natural gas supply,” Wiggins concludes. “Since the onset of shale production on a large scale, we have had year after year of stability for consumers.”
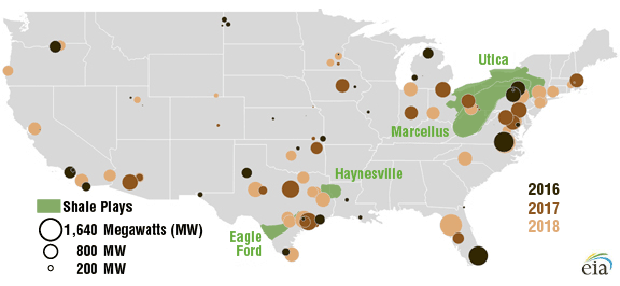
FIGURE 1
Natural Gas-Fired Capacity Additions (2016-18)
Note: Natural gas-fired capacity additions include plants completed and under construction
Gas-Fired Capacity Additions
Meanwhile, the U.S. Energy Information Administration reports that natural gas-fired power generation increased 19 percent in 2015, and forecasts that natural gas-fired generation will exceed coal generation in the United States on an annual basis this year.
With 18.7 gigawatts of new capacity scheduled to come on line between 2016 and 2018, EIA says growth in natural gas-fired generation capacity is expected to continue over the next several years. Many of the new natural gas-fired capacity additions are near major shale gas plays (Figure 1). EIA says the Mid-Atlantic states and Texas have the most natural gas-fired capacity additions under construction with planned on-line dates within the next three years.
In the Mid-Atlantic, EIA says many natural gas capacity additions are concentrated around the Marcellus and Utica regions of Pennsylvania, West Virginia and Ohio. Virginia accounts for the largest cumulative additions of gas-fired capacity in 2016-18, with 2.3 gw of gas-fired capacity under construction, followed by Ohio with 1.9 gw, Pennsylvania with 1.8 gw, and Massachusetts with 0.7 gw, according to EIA.
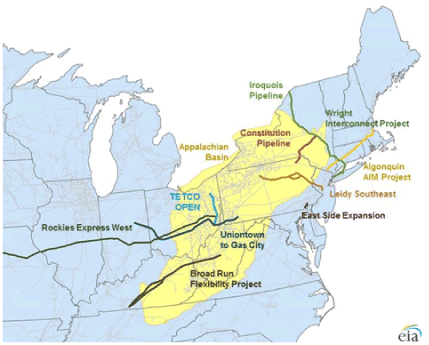
Expanding pipeline networks in the Northeast (Figure 2) are increasing take-away capacity from the Marcellus and Utica shale plays, supporting the growth in natural gas-fired generating capacity. In 2015, EIA reports, 6.0 Bcf/d of new Northeast pipeline take-away capacity was commissioned to transport natural gas to the east, south and west from the Marcellus and Utica. In 2016, 2.2 Bcf/d of new pipeline capacity is scheduled to come on line in the region, according to EIA data.
Significant levels of natural gas-fired capacity also are under construction in Texas, with 3.2 gw expected to become operational by 2018, EIA continues, while Florida has the largest cumulative additions of gas-fired capacity under construction with three plants totaling a combined 3.8 gw that are expected to enter service within the next couple years.
The Mid-Atlantic states and Texas also have the most regulatory permit filings for new gas-fired capacity additions yet to begin construction, EIA mentions. Combined, the agency says, the received and pending construction permit filings amount to a cumulative 12.1 gw of potential new capacity additions by 2018, with Texas accounting for 6.6 gw of the total.
For other great articles about exploration, drilling, completions and production, subscribe to The American Oil & Gas Reporter and bookmark www.aogr.com.


