Shale Gas Creating New Opportunities
By D.K. Das
HOUSTON–Driven by global economic growth, energy demand in developing countries has increased exponentially during the past decade. Meanwhile, energy consumption in developed nations has been trending gradually toward lower-carbon resources. Taken together, emerging as well as developed countries are gradually shifting toward natural gas as one of their main energy resources.
Recognizing this, over the past decade, Australia, Qatar and Russia have taken massive steps to boost their natural gas production to cater to the growing global need for natural gas, and a large and growing percentage of their exports has been shipped as LNG. Australia aspires to be a leading player in the LNG market, and has targeted multiple countries in the Far East as customers for LNG from projects in Western Australia, the Timor Sea and Queensland.
These LNG projects, initiated one after another, are encountering a multitude of problems ranging from an acute scarcity of skilled manpower to uncertainties associated with applying new technology. However, foreign utilities and integrated oil and gas companies have realized Australia’s potential and have become minority shareholders. Given this reality, LNG exports from Australia are expected to triple by 2020.
Meanwhile, Russia intends to use its immense reserves to pursue its strategic and geopolitical interests. Russia has expanded its customer base beyond Europe and has started to supply natural gas to China as well. Looking further into the horizon, Russia constructed a large LNG facility on Sakhalin Island in 2009 to cater to demand from Japan’s Tokyo Gas and Tokyo Electric Power. Russia also is building a 10 million metric ton-per-annum (MMtpa) LNG facility in Vladivostok, which is scheduled to come on stream in 2017.
Qatar, another natural gas giant, is taking a breather after a decade of spectacular growth that allowed it to reach capacities of 77 MMtpa. As an LNG exporter, Qatar is in an entirely different league. Qatar’s natural gas production is often so liquids-rich that, in practical terms, it simply can give away the gas and still make substantial profits by monetizing the natural gas liquids. In spite of this, Qatar has opted to liquefy its dry natural gas for international markets.
Impact Of Shale Gas
The LNG marketplace has been impacted greatly by discoveries of massive amounts of shale gas in the United States. In fact, the viability of exporting U.S. LNG is closely tied to the future of the shale gas industry. With these new-found domestic reserves, the nation has the capacity to satisfy domestic natural gas demand for an estimated 100 years. U.S. production is averaging 62.4 billion cubic feet a day (and growing), which can almost fully satisfy domestic demand. Consequently, net natural gas imports into the United States have fallen to historic lows of 600 million cubic feet a day.
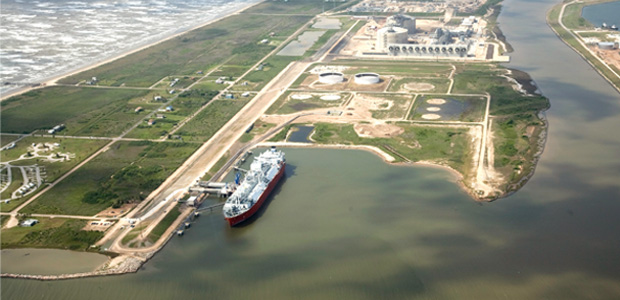
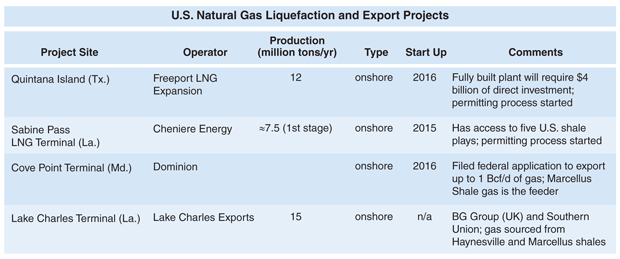
With increasing demand for LNG in the world’s emerging economies on one hand, and surplus availability within the United States on the other, the opportunity exists for America to become an LNG exporter–albeit on a much smaller scale than Australia–to Far East gas consumers. Table 1 is a list of active U.S. LNG export projects and operators.
Japan and South Korea are the world’s two largest LNG consuming markets (importing 93.5 billion and 44.4 billion cubic meters in 2010, respectively). Other large markets in the Far East region are Taiwan (14.9 Bcm) and China (12.8 Bcm).
Japan imports LNG from a number of countries, but supplies from Indonesia, Malaysia, Australia and Qatar accounted for nearly 70 percent of its imports in 2009 and 2010. Qatar’s share averaged 11.5 percent of the total during these two years. Although Qatar has the ability to decimate its competitors and capture a sizable chunk of the LNG market, for strategic purposes, Japan–like all other large LNG consumers–is careful to avoid reliance on a single source. Furthermore, Qatar’s location in the politically volatile Persian Gulf induces LNG consumers to diversify their suppliers.
Russia provided 6.4 percent of Japan’s LNG supplies in 2009-10. In spite of its vast reserves, Russia is viewed as a somewhat less reliable supplier, given Europe’s experience with Russian gas. Indonesia, Malaysia and Australia each provided almost 20 percent of Japan’s LNG imports. Given this scenario, Japan, naturally, has an incentive to further diversify its supply sources to achieve better price control and reliability in case of adverse weather or geopolitical events.
Moreover, an additional opportunity to supply LNG to Japan has opened after the nuclear disasters caused by the March 2011 earthquake. Japan’s new energy strategy calls for canceling 12 planned nuclear power plants and increasing thermal electricity generation, with LNG as the main fuel along with fuel oil, crude oil and coal. It is estimated that Japan will import an additional 11 Bcm of gas this year to offset the loss of nuclear power generation.
At the same time, China’s 12th five-year plan (2011-15) aims to increase the country’s annual gas consumption to 260 Bcm (9.18 trillion cubic feet). Overall, it is expected that the global LNG demand pie will expand substantially in the near future, which will lead to U.S. LNG export opportunities.
Differentiating U.S. LNG
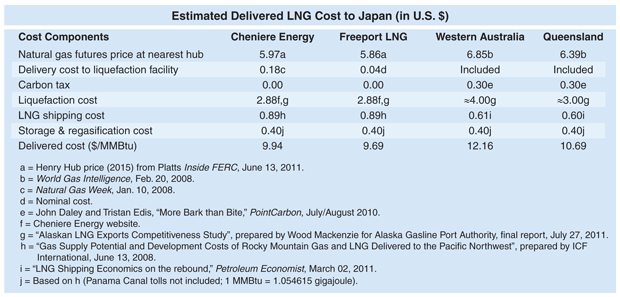
LNG is a commoditized product and there is limited opportunity for product differentiation. Therefore, cost efficiency is one of the primary strategies for marketing LNG. Table 2 shows U.S. cost competitiveness compared with Australian LNG. It appears that the United States can deliver LNG at $0.75-$2.47 an MMBtu less than Australian export terminals, which indicates U.S. LNG exports can, at a minimum, provide serious competition.
Two of the largest contributors to LNG delivered cost are the futures price at the nearest hub and liquefaction costs. The futures prices indicated in Table 2 for the Cheniere and Freeport facilities are for 2015, when first delivery from Cheniere is expected. The full-cycle cost of gas when all costs are amortized is in the $6-$8 an Mcf range, although costs could be somewhat lower for certain liquids-rich plays.
With natural gas prices well below $4.00 an MMBtu, it should be expected that market fundamentals will take over, implying that the break-even costs of dry gas will rise above $6/MMBtu at some point in the near future. Given this observation and taking into consideration the huge expected demand from Japan, South Korea, China and India, it would appear that potential North American LNG exporters would be wise to lock in long-term futures contracts with local producers and adequately hedge them without delay. Such steps would assure prospective clients access to guaranteed volumes of gas while simultaneously providing steady cash flow to gas producers.
In regard to liquefaction cost, the challenge is to explore whether costs can be reduced to improve profit margins. Although operating costs at liquefaction plants can be reduced by adding more trains, some experts contend the more efficient way to reduce costs is to increase throughput per train. Liquefaction costs depend on capacity utilization. In an industry with higher fixed costs, higher utilization rates allow faster recovery of invested capital.
Barring technical flaws with new plants, the only factors that could negatively affect capacity utilization at U.S. liquefaction plants are government intervention to reserve more gas for domestic use, lack of enough definitive agreements with buyers to use liquefaction capacity, or a deficit in natural gas supply.
Competitiveness Factors
Although costs can play an important role in U.S. LNG competitiveness, there are other factors that can improve the competitiveness of U.S. LNG exports. These are the calorific value of LNG, mutual trust, participation of LNG buyers as equity shareholders, political risk, tax regimes, LNG use in fertilizer production, participation in the LNG value chain, and LNG risk management.
North American LNG producers can highlight the low calorific values of Australian LNG generated from coalbed methane, which may prove unsuitable for some Asian markets (including Japan) that prefer high-heating capacity gas. Although Australian producers can fix this problem through blending and creating extra storage infrastructure, the process would add costs.
Developing mutual trust can help U.S. suppliers penetrate Japanese markets. Japan and other Asian nations place an enormous amount of importance on working with business partners with whom they have developed mutual trust over time. The Conoco/Marathon Kenai LNG plant in Alaska has supplied 1,300 loads of LNG to Tokyo Electric and Tokyo Gas safely and without interruption since 1969. This enviable supply record has been instrumental in gaining Japanese trust and can be harnessed by future U.S. LNG exporters.
When Japan is drastically increasing the contribution of natural gas to its energy mix may be an opportune time to open communications with Japanese utilities and gas companies.
Another way to gain the confidence of prospective LNG buyers is to invite reputable oil and gas companies, natural gas middlemen, and potential long-term LNG customers to take partial ownership in new LNG export ventures. This is done often to help finance LNG facilities, which are notorious for very high capital costs. Such measures guarantee LNG exporters a certain capacity utilization rate and give LNG buyers a higher degree of reliability.
One example is the equity held in Qatargas by several parties, including Qatar Petroleum (65 percent), Total (10 percent), ExxonMobil (10 percent), Mitsui (7.5 percent) and Marubeni (7.5 percent). Among Australian LNG producers, Woodside’s Pluto project has three joint venture partners–Woodside (90 percent), Tokyo Gas (5 percent) and Kansai Electric (5 percent)–along with 15-year sales agreements with Tokyo Gas and Kansai Electric. Often, smaller percentage owners are the LNG buyers, with co-ownership aligning the interests of buyers as well as producers, the state and LNG exporters.
Political Risk
At the moment, political risk is the biggest factor playing against U.S. LNG exports. In this case, political risk means a lack of political commitment or support from the government for producing and exporting shale gas. Lack of political will and direction drives away capital funding, which is critical for high-cost LNG projects.
Passing HR 1380, the NAT GAS Act of 2011, would be highly beneficial. The bill includes extending the tax credit for natural gas used as a transportation fuel, a new tax credit for manufacturing natural gas vehicles, a tax credit on the incremental cost of buying natural gas vehicles, and a tax credit for constructing natural gas refueling stations.
Introduced in the U.S. Senate in November, the act would encourage production and ensure ready availability of future gas supplies for export as LNG. More importantly, it would lead to higher royalties for landowners and create substantial employment opportunities in the natural gas sector. In addition, it would result in more tax revenues for state and federal governments, and help in developing new hydraulic fracturing methods.
LNG also has potential application in producing fertilizer. A primary type of fertilizer uses the Haber-Bosch process to combine methane from natural gas with nitrogen from the atmosphere to produce ammonia. In fact, the food base of half the world’s population depends on nitrogen-based products from the Haber-Bosch process. This provides a huge incentive to determine the requirements for using natural gas as a feedstock in the chemical processes involved in manufacturing nitrogen-based fertilizers. U.S. LNG producers can supply fertilizer companies directly in foreign countries or participate in joint venture enterprises.
The LNG value chain consists of gas production, liquefaction plants, shipping, regasification facilities, and pipeline delivery. Vertical integration from gas production to pipeline delivery in a foreign country would be an expensive proposition and could be a regulatory nightmare. Therefore, U.S. LNG exporters should examine the feasibility of tapping into certain components of the LNG value chain on a case-by-case basis, or packaging LNG supply with other products.
On the downstream side, exporters may consider the possibility of becoming part owners of their client country’s gas pipeline network, providing compressors and storage infrastructure, installing blending and metering station facilities, or participating in long-term build/operate/transfer processes in addition to long-term LNG supply contracts.
In the midstream space, owning ships could help the LNG exporter assure timely supply of LNG. Supplying heavy-duty LNG trucks and setting up LNG stations also could be investigated. Central American countries such as Costa Rica and El Salvador, and Caribbean nations such as Jamaica and the Bahamas, could be potential partners in complete LNG value chain deals.
Complex Web
In regard to LNG risk management, the supply chain is a complex web of activities and requires all parts to function and deliver simultaneously. Typically, a 5 million ton-a-year project requires a capital expenditure of $7 billion-$10 billion for the entire chain, and weekly capital costs of $10 million to generate a product with a value of $30 million-$40 million. Mistakes or delays in any part of the chain can have significant financial implications.
Even so, according to one survey, 50 percent of export terminal projects have experienced significant delays. The causes vary considerably, ranging from political issues to design faults and supply problems. The primary risk management strategy is to mitigate delays, and the backup plan consists of inserting risk-sharing clauses into contractual frameworks and allowing flexibility in business models to select alternative delivery options.
Implementing a risk management process at the earliest phase of a project helps identify potential risks. Once risks are identified, mitigation strategies and plans can be drawn, responsibilities allocated, and follow-up procedures incorporated in the project management schedule. As a project proceeds, plans can be revised, if need be, to cover unforeseen risks.
For maximum efficiency, risk identification should focus on the development stage, and should identify issues related to location, business model and contractual strategy; permitting processes and strategies; and project organization.
There are several risks related to quality control, the robustness of project planning, and implementation, including cooperation between vendors and subcontractors. Following a structured risk-based verification (RBV) process assures correct implementation of project steps the first time around to ensure compliance with quality requirements both in execution and operation.
Introducing a new process or technology always poses risks, making it important to develop specific programs to identify, evaluate and mitigate new technology risk. Such programs can be set up using the RP A203 code (Qualification Procedures for New Technology).
Often, risks are generated by a lack of foolproof project planning and implementation. An RBV scheme that includes independent appraisals of project development can be implemented to help concentrate efforts where they are cost effective. A new specification (DSS315, Verification of Onshore LNG and Gas Facilities) has been issued to incorporate lessons learned from the LNG sector during project development.
Although Australia has geared to satisfy a global upsurge in natural gas consumption by initiating massive LNG projects, U.S. LNG exports to the Far East can be competitive. Lower natural gas prices are the biggest advantage for U.S. LNG exporters, thanks to shale gas, and higher profit margins could be obtained by tapping into the LNG value chain instead of concentrating on LNG exports alone.

D.K. DAS is a project engineer at UniversalPegasus International, an engineering, project management and construction management firm headquartered in Houston. Das holds an M.S. from the University of British Columbia and an M.B.A. from the University of Chicago Graduate School of Business.
For other great articles about exploration, drilling, completions and production, subscribe to The American Oil & Gas Reporter and bookmark www.aogr.com.


