U.S. Shale Well Productivities, LNG Exports Trend Higher
WASHINGTON–While new well production per rig, a measure of well productivity, is projected to decline slightly in most domestic shale plays in October as a function of increasing rig counts targeting fewer premium high-graded locations, the industry continues to make noteworthy productivity gains, according to the U.S. Energy Information Administration.
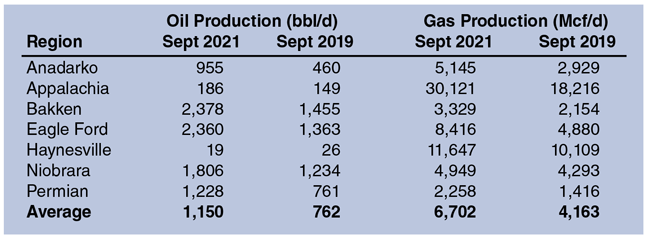
Compared to September 2019, new-well production climbed from 762 bbl/d to 1,150 bbl/d while new-well natural gas production per rig soared from 4,163 to 6,702 Mcf/d. Significant productivity gains were recorded across the board in every tight oil play, led by a 73% increase in the Eagle Ford, 63% in the Bakken, 61% in the Permian, 48% in the Anadarko, and 46% in the Niobrara (Table 1).
The story is similar in gas shale plays, where Appalachia led the way with a 65% increase, followed by the Haynesville with 15%. However, the largest percentage gains occurred in the Anadarko and Eagle Ford, where new-well gas production per rig jumped by 75% and 72%, respectively. Permian gas output per new well was up 59%, just ahead of the Bakken at 54%.
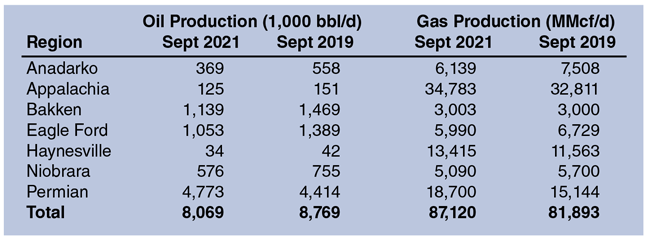
Looking at production totals from the “Big Seven” U.S. shale regions (Table 2), EIA data indicate that oil output in September still lagged September 2019 by 700,000 bbl/d. Oil production was down in every region compared to two years ago except the Permian, where it grew by 359,000 bbl/d.
The Permian Basin also had the most growth in natural gas production at 3.6 billion cubic feet a day, nearly equaling the combined increase in Appalachia (just short of 2.0 Bcf/d) and the Haynesville (1.8 Bcf/d). Together, these three plays were more than enough to offset gas production declines in other shale plays, allowing the total volume to grow from 81.9 Bcf/d in September 2019 to a record 87.1 Bcf/d estimated this September.
For October, EIA forecasts production growth in every shale region except the Anadarko, with the seven major U.S. shale regions adding a combined 66,000 bbl/d in oil output and another 219 MMcf/d of natural gas.
Increasingly, new production will have to come from new-drills given a shrinking population of drilled but uncompleted wells. According to EIA, DUCs declined in every shale play in August, continuing a months-long trend that has seen the total number of DUCs in the Big Seven plays fall to 5,713. That was down from 7,665 in August 2020 and 7,950 in August 2019.
In the Permian, DUCs were reduced from 3,839 two years ago to 2,119 last month, with the Eagle Ford going from 1,458 to 869 DUCs over the same period. The only plays with more DUCs this August than in the same month in 2019 were the Haynesville (371 versus 186) and Marcellus (574 versus 517) gas shales.
A new supplemental report from EIA examines gas‐to‐oil ratios in the five principal tight oil plays: Anadarko, Bakken, Eagle Ford, Niobrara, and Permian. Across these plays, GORs tend to increases over time, leading to wells being reclassified from “oil” to “natural gas” in the agency’s annual reporting of producing U.S. wells. Using a gas‐to‐oil ratio of 6,000 cubic feet/barrel of oil as the standard, EIA estimates that in 2020 it reclassified more than 9,000 wells from oil to natural gas as a result of higher gas production in these primary oil‐producing tight oil regions.
Figures 1A and 1B show updated GORs and oil well decline curves from the new report, while Figures 2A and 2B show the same datasets for Bakken oil wells.
FIGURE 1A & 1B
GORs for all Permian Basin Wells by Year Drilled
Oil Decline Curves for New Permian Basin Oil Wells by Year Drilled
Source: U.S. Energy Information Administration, Drilling Productivity Report
Note: Each curve represents average GOR of all wells starting production in a given year. Each curve represents average oil production of all wells starting production in a given year.
FIGURE 2A & 2B
GORs for all Bakken Wells by Year Drilled
Oil Decline Curves for New Permian Basin Oil Wells by Year Drilled
Source: U.S. Energy Information Administration, Drilling Productivity Report
Note: Each curve represents average GOR of all wells starting production in a given year. Each curve represents average oil production of all wells starting production in a given year.
Record LNG Exports
Accelerating gas output from shale regions is feeding growing U.S. liquefied natural gas exports, which hit yet another record high in the first half this year. Through the end of June, LNG exports averaged 9.6 Bcf/d, representing an increase of 42% (2.8 Bcf/d) compared with the same period last year.
Outbound U.S. LNG cargoes increased in the first half of the year as international natural gas and LNG spot prices rose across Asian and European markets in response to cold winter weather and continued easing of COVID-19 restrictions, EIA reports.
“In Asia, colder-than-normal winter temperatures led to increased demand for spot LNG imports,” the agency explains in a summary. “Natural gas demand in the spring continued to rise amid low post-winter inventories, which contributed to unseasonably high natural gas prices. The high prices prompted a higher demand for more flexible LNG supplies, particularly from the United States.”
Natural gas inventories were also drawn down in Europe last winter, followed last spring by unseasonably hot temperatures and greater natural gas demand from the electric power sector. EIA notes that while European natural gas spot prices have historically been lower than spot prices in Asia, this year Europe’s prices are tracking Asia’s spot LNG prices more closely to attract flexible LNG supplies to refill depleted storage volumes.
Although Henry Hub benchmark and U.S. LNG spot market prices have been strong in 2021 relative the past several years, EIA points out that robust U.S. LNG exports are supported by the fact that natural gas in the domestic market remains priced well below international natural gas and spot LNG prices, encouraging exports of U.S. LNG.
New domestic liquefaction capacity that came online over the past several months is making the increased volumes possible. In 2020, the final liquefaction trains were commissioned at Freeport, Cameron, and Corpus Christi, and the remaining smaller-scale units were placed in service at Elba Island. The new units increased total U.S. LNG export capacity by a combined 2.7 Bcf/d for a total peak capacity of 10.8 Bcf/d.
Similar to last year, Asia remained the top destination for U.S. LNG exports through the first five months of 2021, accounting for 46% of the total. Europe was second, with a five-month average share of 37%. Exports to Latin America also increased. “We expect LNG exports to remain at high levels in the remaining months of this year,” EIA concludes.
For other great articles about exploration, drilling, completions and production, subscribe to The American Oil & Gas Reporter and bookmark www.aogr.com.


